Fig. 15.
Download original image
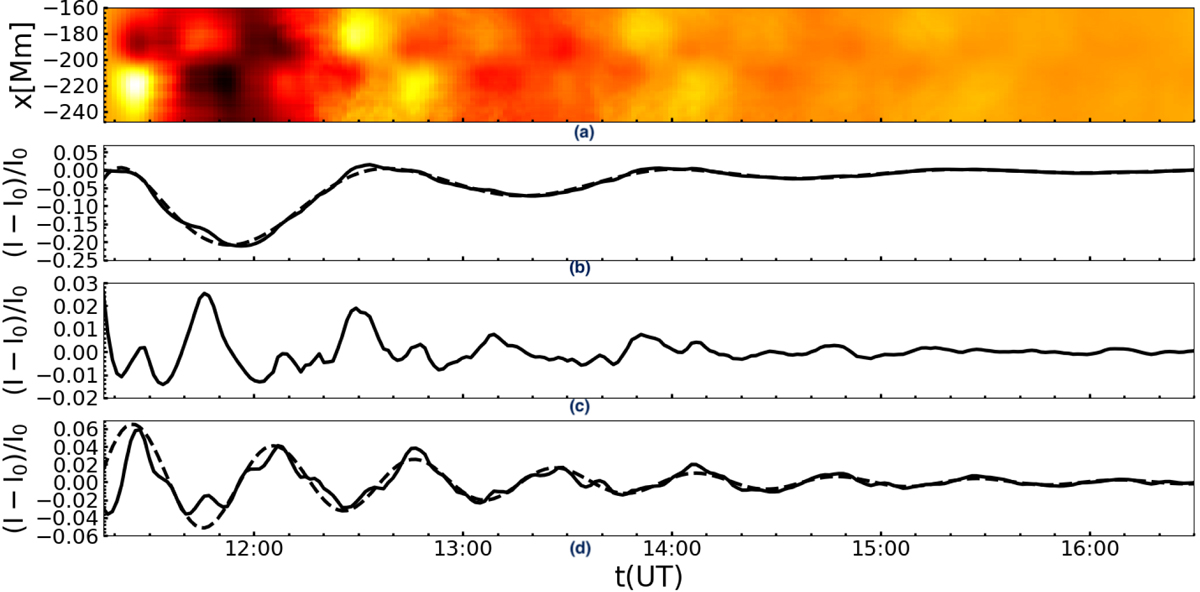
Synthetic relative intensity variations in the SDO/AIA 171Å bandpass. (a) Intensity variations, averaged along a set of LOS rays as shown in Fig. 14, as a function of time, obtained numerically for an oscillation beginning at 11:19 UT. (b) Relative intensity averaged over the transverse coordinate as a function of time. The dashed line is a smooth slow trend fitted using a Savitzky-Golay filter. (c) Relative intensity as a function of time found after subtracting the slow trend. (d) Relative intensity as a function of time found after subtracting the slow trend from a time series where the relative intensity in panel (a) has been averaged only over the outer half of the loop, i.e. over the transverse interval for x between −248 and −200 Mm in the numerical domain. The dashed line is a damped sinusoidal fit.
Current usage metrics show cumulative count of Article Views (full-text article views including HTML views, PDF and ePub downloads, according to the available data) and Abstracts Views on Vision4Press platform.
Data correspond to usage on the plateform after 2015. The current usage metrics is available 48-96 hours after online publication and is updated daily on week days.
Initial download of the metrics may take a while.