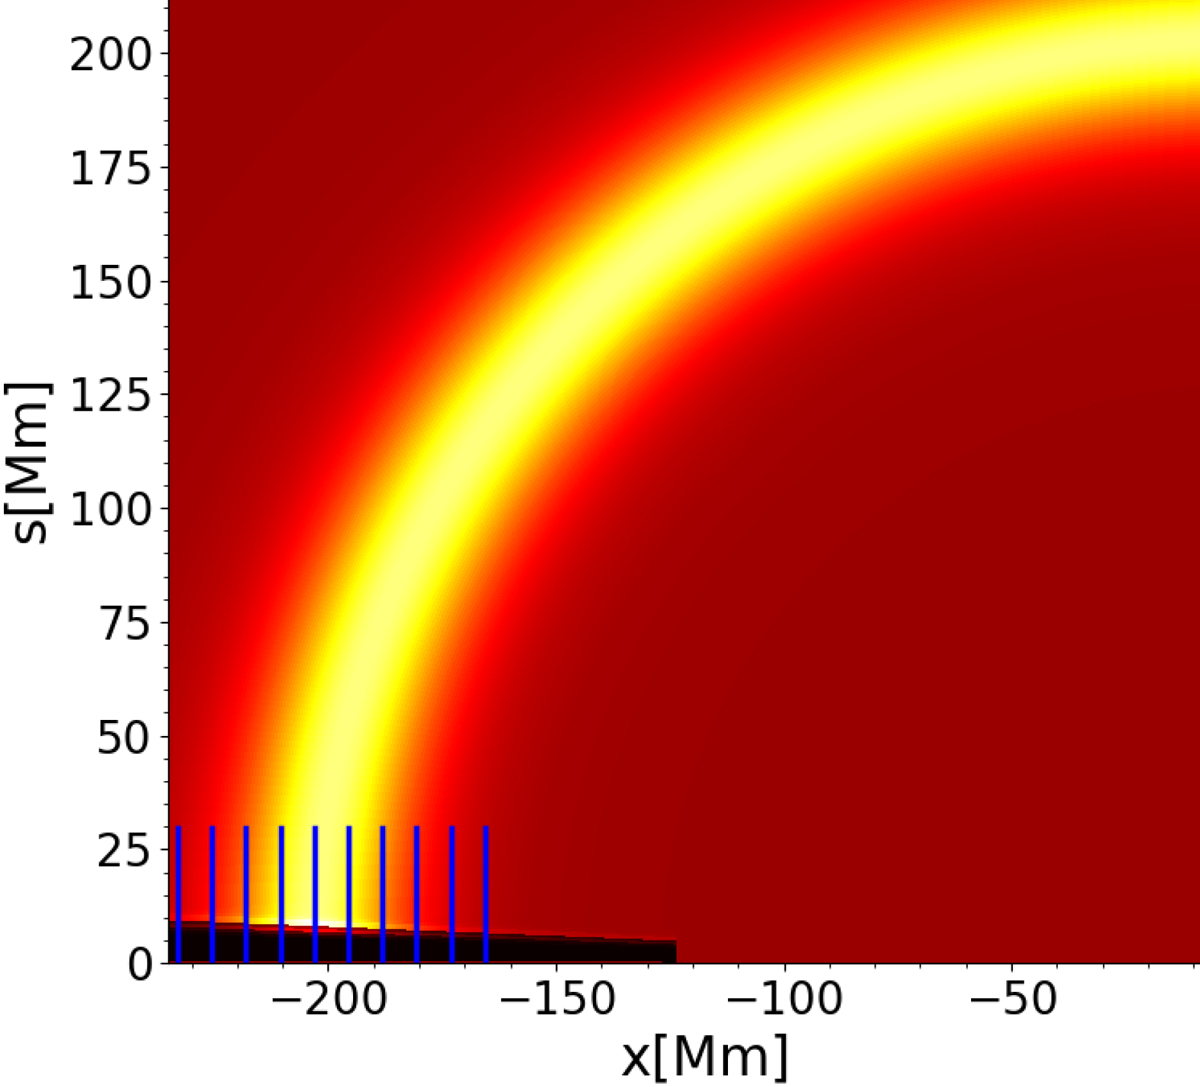
Fig. 14.
Download original image
Straight loop simulation mapped to a semi-circular grid. Only one half of the numerical domain is shown. The emissivity, ρ2, has been passed through the SDO/AIA 171 Å temperature response function to show the intensity in that bandpass. There is no resulting intensity from the chromosphere or the transition region due to the 171 Å temperature response. Solid blue lines show LOS rays taken from the footpoint from s = 0 to 30 Mm height.
Current usage metrics show cumulative count of Article Views (full-text article views including HTML views, PDF and ePub downloads, according to the available data) and Abstracts Views on Vision4Press platform.
Data correspond to usage on the plateform after 2015. The current usage metrics is available 48-96 hours after online publication and is updated daily on week days.
Initial download of the metrics may take a while.