Fig. 13.
Download original image
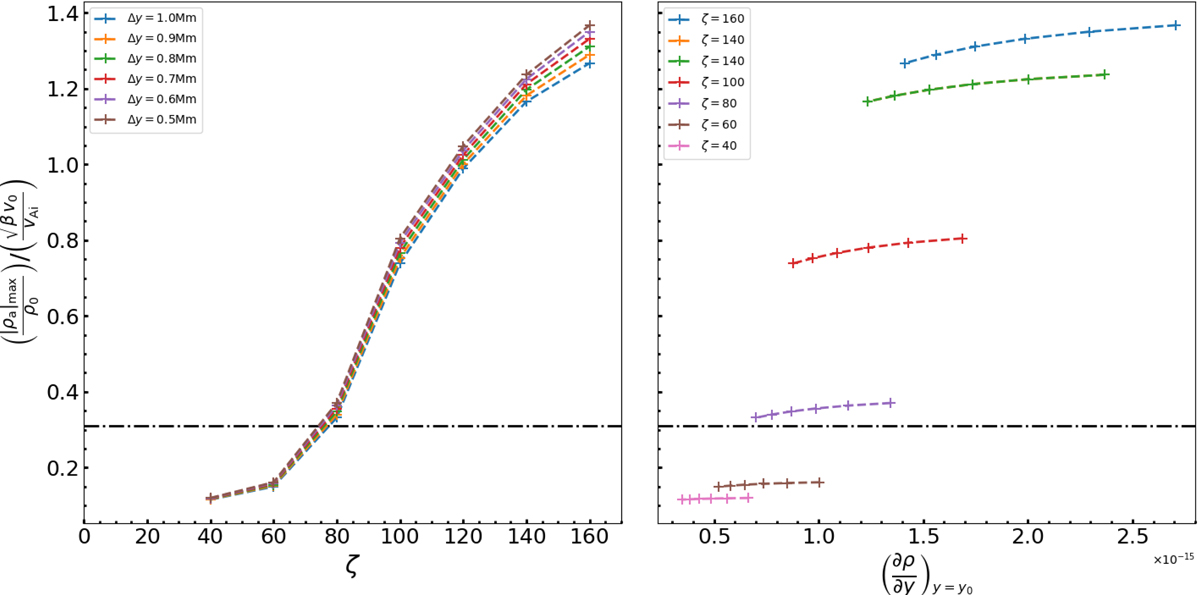
Relative maximum slow mode density perturbation in the corona. We divided this by ![]() to allow this plot to be used as a reference. Left: as a function of the density contrast between the chromosphere and the corona for different transition region widths, Δy. Right: as a function of the density gradient at y = y0 and the corona for different transition region widths, Δy. The horizontal dashed-dotted lines give the value of the perturbation for a loop with no atmosphere. Connecting lines have been included to both plots as visual aids.
to allow this plot to be used as a reference. Left: as a function of the density contrast between the chromosphere and the corona for different transition region widths, Δy. Right: as a function of the density gradient at y = y0 and the corona for different transition region widths, Δy. The horizontal dashed-dotted lines give the value of the perturbation for a loop with no atmosphere. Connecting lines have been included to both plots as visual aids.
Current usage metrics show cumulative count of Article Views (full-text article views including HTML views, PDF and ePub downloads, according to the available data) and Abstracts Views on Vision4Press platform.
Data correspond to usage on the plateform after 2015. The current usage metrics is available 48-96 hours after online publication and is updated daily on week days.
Initial download of the metrics may take a while.