Fig. 9.
Download original image
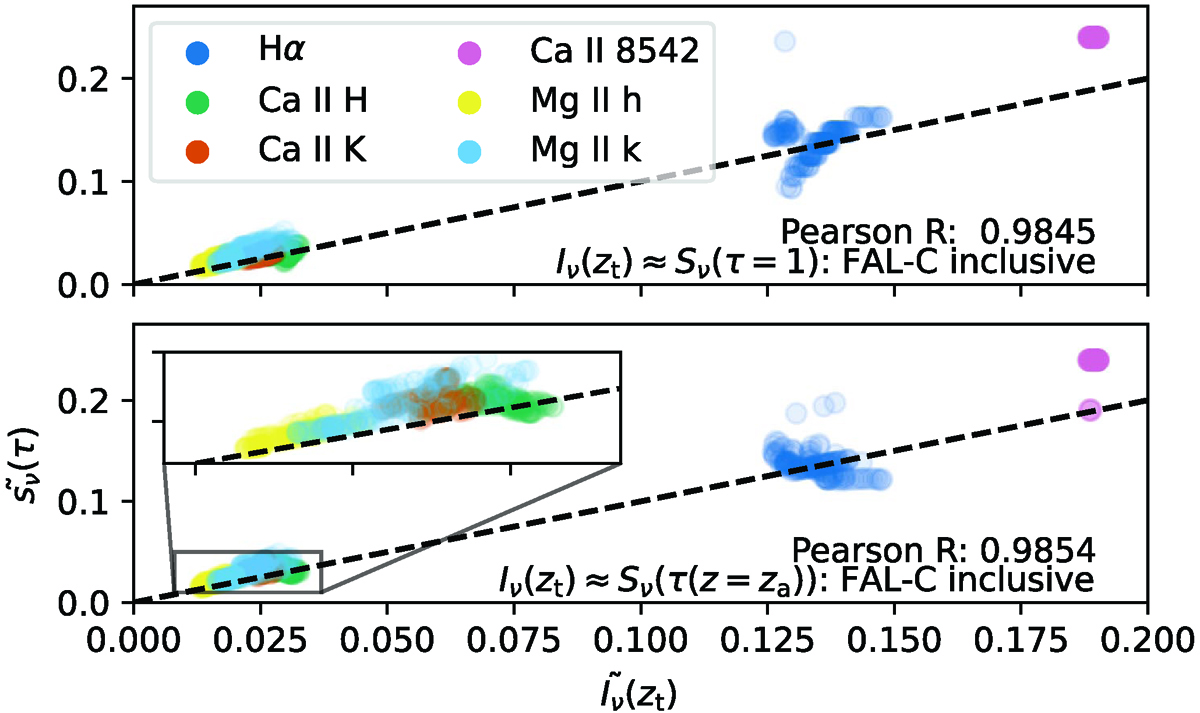
Relationship between emergent intensity and different assumptions for where the majority of the emergent intensity comes from within the spatial distribution of the source function. The dashed-black line indicates in each case a 1–1 relation between ![]() and
and ![]() , wherein the ∼ signifies the quantity is normalised by a nearby continuum value.
, wherein the ∼ signifies the quantity is normalised by a nearby continuum value.
Current usage metrics show cumulative count of Article Views (full-text article views including HTML views, PDF and ePub downloads, according to the available data) and Abstracts Views on Vision4Press platform.
Data correspond to usage on the plateform after 2015. The current usage metrics is available 48-96 hours after online publication and is updated daily on week days.
Initial download of the metrics may take a while.