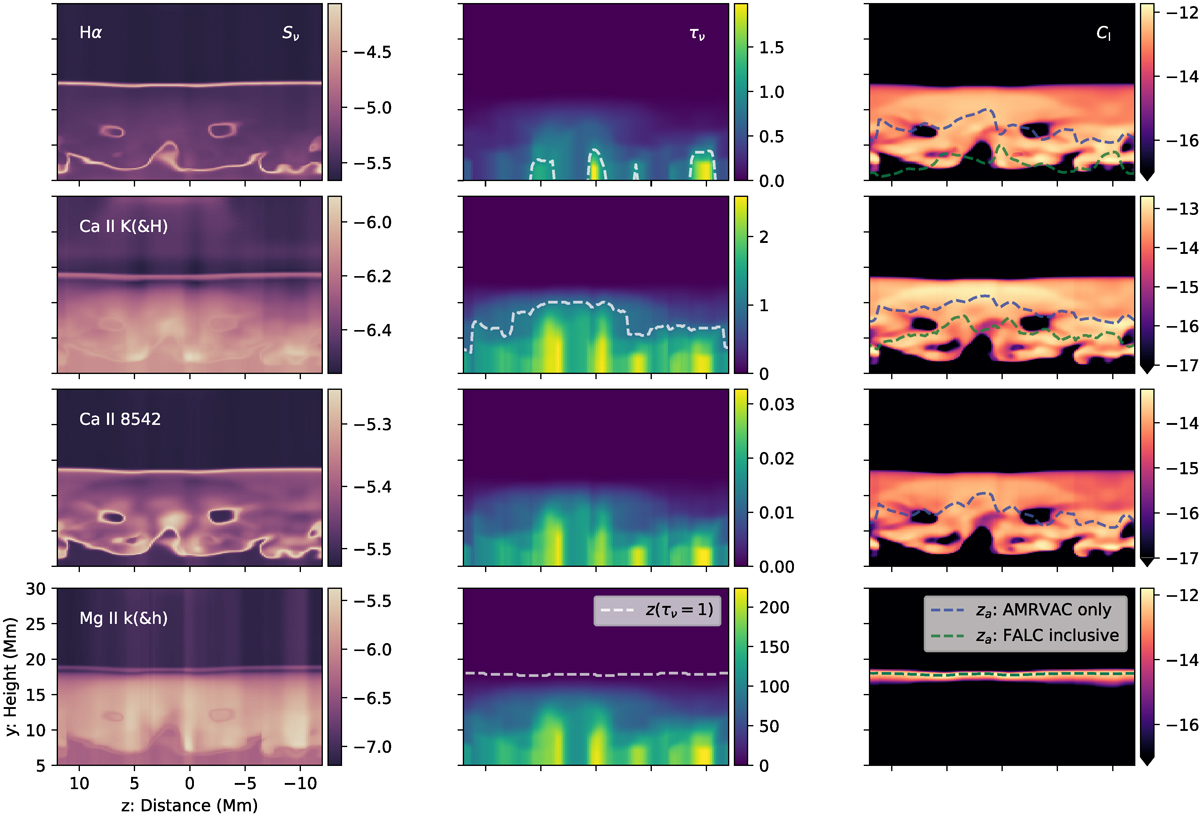
Fig. 8.
Download original image
Line core formation properties within a cut through x = 0 Mm of the filament synthesis. The source function Sν and integrated opacity τν, and associated contribution function CI are shown for four of the six line core transitions shown in Figs. 5 and 7. The dashed lines overlaid on the τν and CI quantities are the location of τν = 1, and the average formation height za quantity calculated for both an MPI-AMRVAC-only and FAL-C-inclusive stratification, respectively, and overlap in the case of Mg II h&k. Sν and CI quantities in units of log10(ergs s−1 cm−2 sr−1 Hz−1).
Current usage metrics show cumulative count of Article Views (full-text article views including HTML views, PDF and ePub downloads, according to the available data) and Abstracts Views on Vision4Press platform.
Data correspond to usage on the plateform after 2015. The current usage metrics is available 48-96 hours after online publication and is updated daily on week days.
Initial download of the metrics may take a while.