Fig. 4.
Download original image
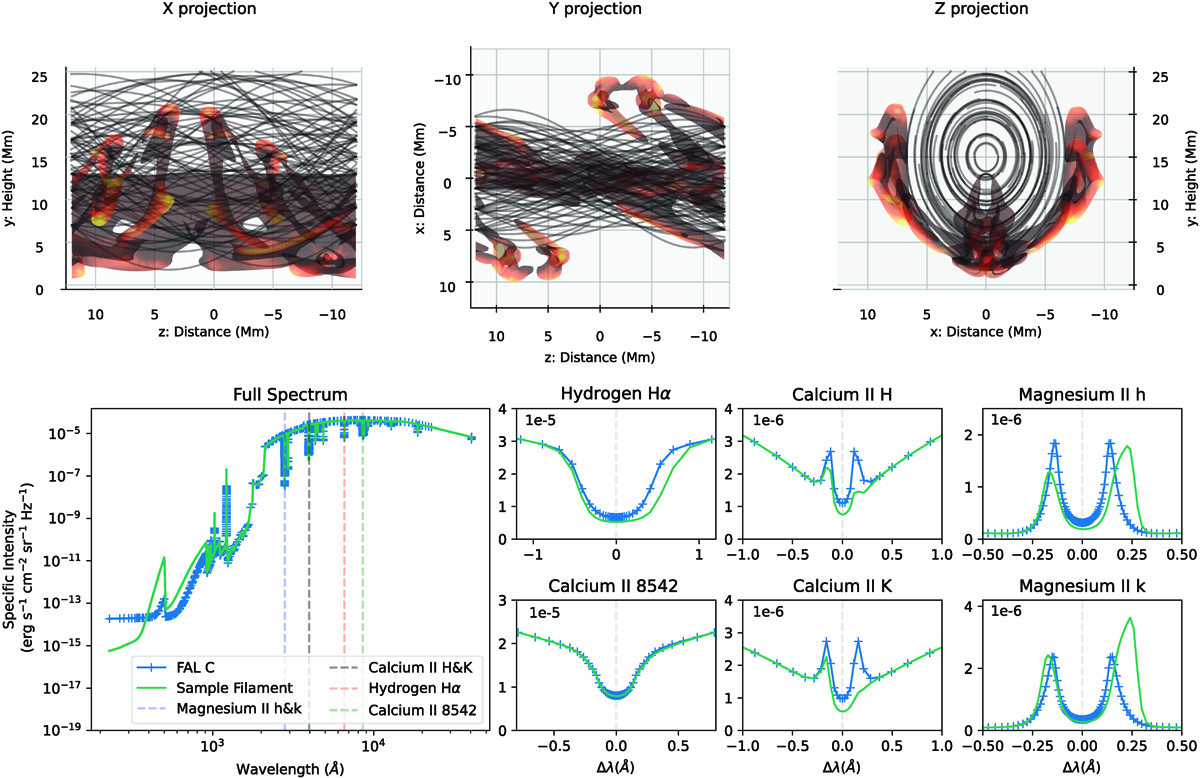
Numerical simulation domain and example spectrum from the filament projection. Top row: axis-aligned representations of the solar filament and prominence simulation completed using MPI-AMRVAC. The cool plasma is bound by a semi-transparent density isocontour of value 1 × 10⁻¹⁴ g cm−3 and coloured black-red-yellow according to the local temperature, cold to hot respectively. Magnetic field lines that reveal the bounding flux rope are traced and overlaid using black, semi-transparent lines. Bottom row: comparison between the synthesis of a coronal, FAL-C model and that of a central position (0,0) Mm within the ‘Y projection’. On the right we show a sample of six lines typically used to observe filaments: Hα, Ca II 8542, Ca II H&K, and Mg II h&k.
Current usage metrics show cumulative count of Article Views (full-text article views including HTML views, PDF and ePub downloads, according to the available data) and Abstracts Views on Vision4Press platform.
Data correspond to usage on the plateform after 2015. The current usage metrics is available 48-96 hours after online publication and is updated daily on week days.
Initial download of the metrics may take a while.