Fig. 5.
Download original image
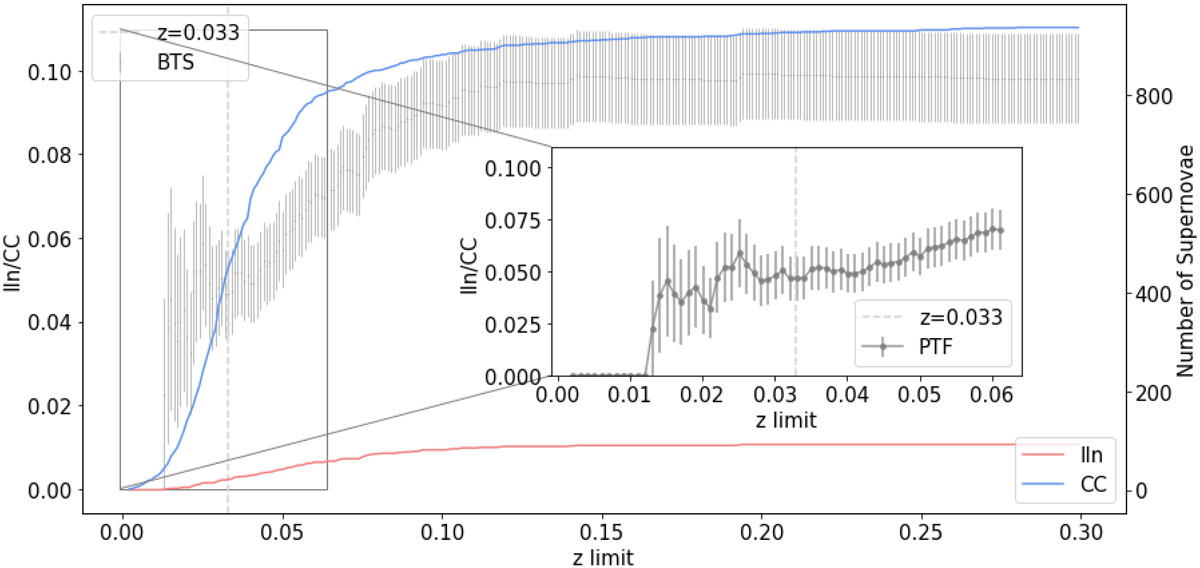
Redshift evolution of SNe-IIn-to-CC ratio. The gray data points represent the cumulative SNe-IIn-to-CC ratio from BTS, indicated on the left y-axis, as a function of redshift limits. The vertical gray dashed line represents the chosen redshift cut. The number of CC SNe and SNe IIn are also depicted as the colored curves, which are indicated on the right y-axis. The inset shows a zoomed-in image of a plot of the cumulative SNe-IIn-to-CC ratio up to redshift 0.06 as well as the chosen redshift cut.
Current usage metrics show cumulative count of Article Views (full-text article views including HTML views, PDF and ePub downloads, according to the available data) and Abstracts Views on Vision4Press platform.
Data correspond to usage on the plateform after 2015. The current usage metrics is available 48-96 hours after online publication and is updated daily on week days.
Initial download of the metrics may take a while.