Fig. 7.
Download original image
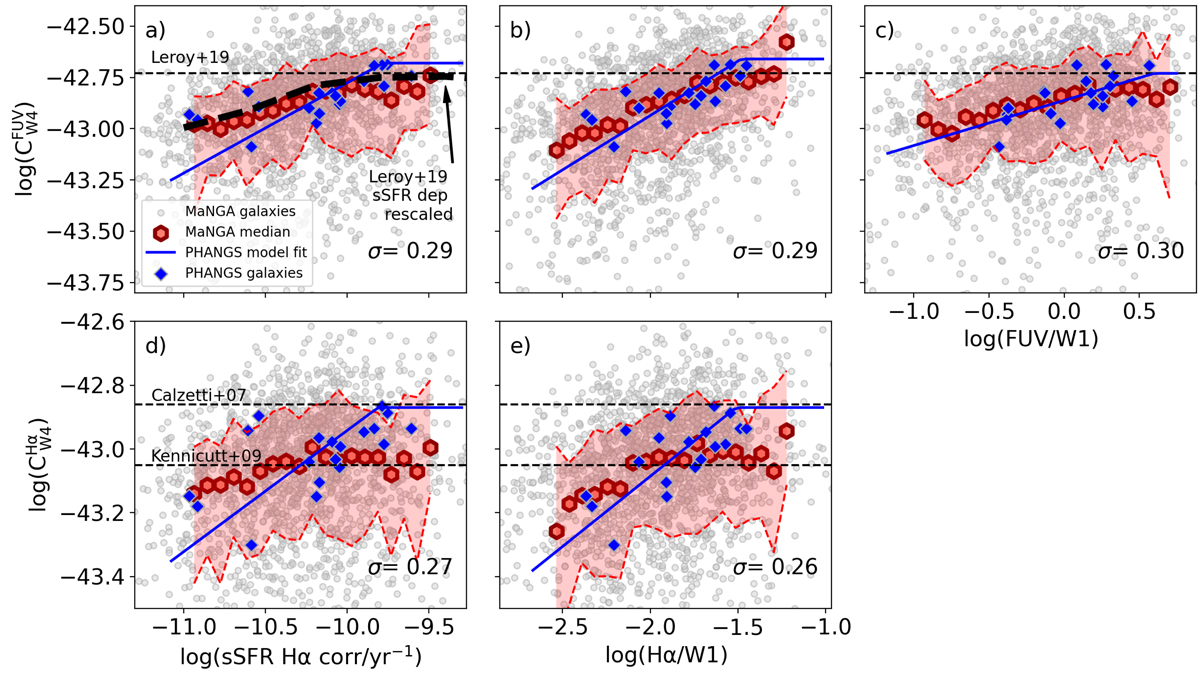
Hybridisation coefficients of W4 with either FUV (panels a, b, and c) or Hα (panels d and e) as a function of sSFR (left), LHα/LW1 (middle), and LFUV/LW1 (right) for the MaNGA sample (using galaxy-integrated fluxes). Best-fit relations obtained for the PHANGS 15″ data (Fig. 5) are shown in blue. Blue diamonds show the results obtained considering the integrated fluxes from the 19 PHANGS galaxies. Values of ![]() and
and ![]() from the literature are shown as dashed horizontal black lines and are labelled in the figure (see text for additional detail). The scatter σ of the data with respect to the best fit is presented in the bottom right corner. The MaNGA data show similar trends as the resolved regions in PHANGS galaxies, even though in general it displays flatter slopes and does not reach the same values of C at the highest sSFR.
from the literature are shown as dashed horizontal black lines and are labelled in the figure (see text for additional detail). The scatter σ of the data with respect to the best fit is presented in the bottom right corner. The MaNGA data show similar trends as the resolved regions in PHANGS galaxies, even though in general it displays flatter slopes and does not reach the same values of C at the highest sSFR.
Current usage metrics show cumulative count of Article Views (full-text article views including HTML views, PDF and ePub downloads, according to the available data) and Abstracts Views on Vision4Press platform.
Data correspond to usage on the plateform after 2015. The current usage metrics is available 48-96 hours after online publication and is updated daily on week days.
Initial download of the metrics may take a while.