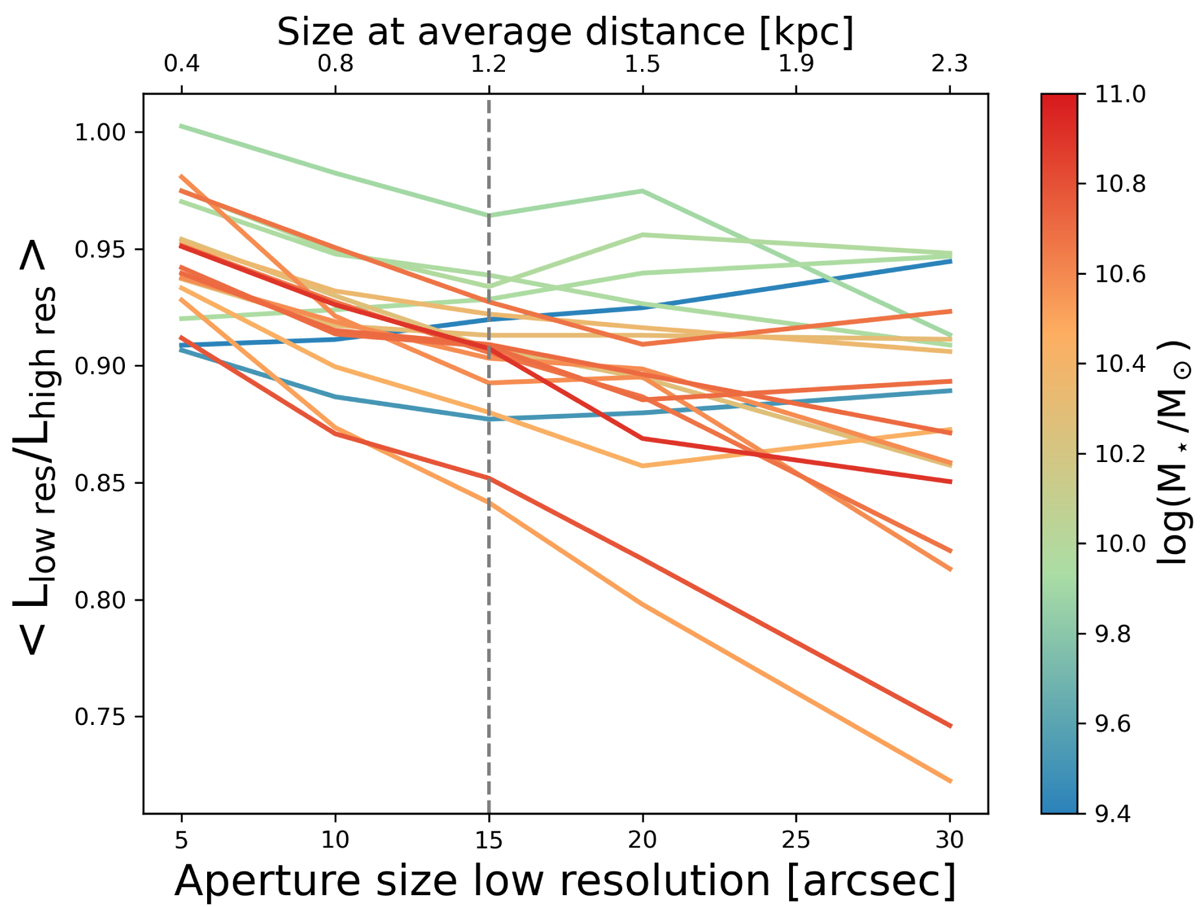
Fig. 6.
Download original image
Mean ratio of the attenuation-corrected Hα luminosity computed in low-resolution apertures of varying size to the luminosity derived at the highest spatial scales accessible with the PHANGS-MUSE data (∼1″) as a function of the low-resolution aperture size. Trends are shown for each of the 19 galaxies in the PHANGS-MUSE sample, colour-coded by total stellar mass. The data for each galaxy were resampled on apertures of 5, 10, 15, 20, and 30″. The alternative x-axis at the top of the plot shows the equivalent physical size in kpc at the median distance of the sample. At 15″ resolution, the resolution of the WISE W4 data, the median difference is 10% (⟨Llow res/Lhigh res⟩ = 0.92).
Current usage metrics show cumulative count of Article Views (full-text article views including HTML views, PDF and ePub downloads, according to the available data) and Abstracts Views on Vision4Press platform.
Data correspond to usage on the plateform after 2015. The current usage metrics is available 48-96 hours after online publication and is updated daily on week days.
Initial download of the metrics may take a while.