Fig. 5.
Download original image
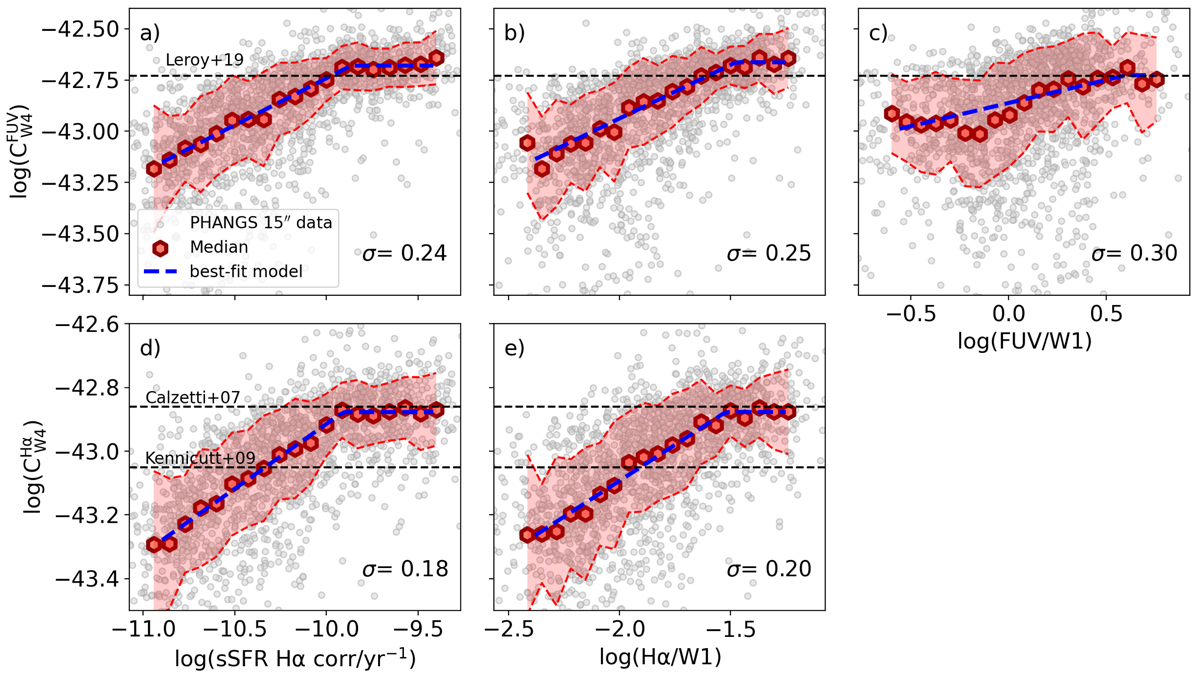
Hybridisation coefficients of W4 with either FUV (![]() , panels a, b, and c) or Hα (
, panels a, b, and c) or Hα (![]() , panels d and e) as a function of sSFR (left), LHα/LW1 (middle), and LFUV/LW1 (right). These coefficients are calibrated to match the SFR obtained from Balmer-decrement-corrected Hα for individual 15″ (∼kpc scale) regions (grey dots). Red hexagons and shaded areas show the median trends and scatter. Median relations are fitted with a broken power law (Eq. (7)), and the best-fit model is shown as a dashed blue line. The scatter σ of the data with respect to the best fit is presented in the bottom right corner. Values of
, panels d and e) as a function of sSFR (left), LHα/LW1 (middle), and LFUV/LW1 (right). These coefficients are calibrated to match the SFR obtained from Balmer-decrement-corrected Hα for individual 15″ (∼kpc scale) regions (grey dots). Red hexagons and shaded areas show the median trends and scatter. Median relations are fitted with a broken power law (Eq. (7)), and the best-fit model is shown as a dashed blue line. The scatter σ of the data with respect to the best fit is presented in the bottom right corner. Values of ![]() and
and ![]() from the literature are shown as dashed black horizontal lines. Our data for kpc scale regions agree well with the literature values at high sSFR, but show a systematic deviation for lower sSFR, which is captured well by the power-law model.
from the literature are shown as dashed black horizontal lines. Our data for kpc scale regions agree well with the literature values at high sSFR, but show a systematic deviation for lower sSFR, which is captured well by the power-law model.
Current usage metrics show cumulative count of Article Views (full-text article views including HTML views, PDF and ePub downloads, according to the available data) and Abstracts Views on Vision4Press platform.
Data correspond to usage on the plateform after 2015. The current usage metrics is available 48-96 hours after online publication and is updated daily on week days.
Initial download of the metrics may take a while.