Fig. 1.
Download original image
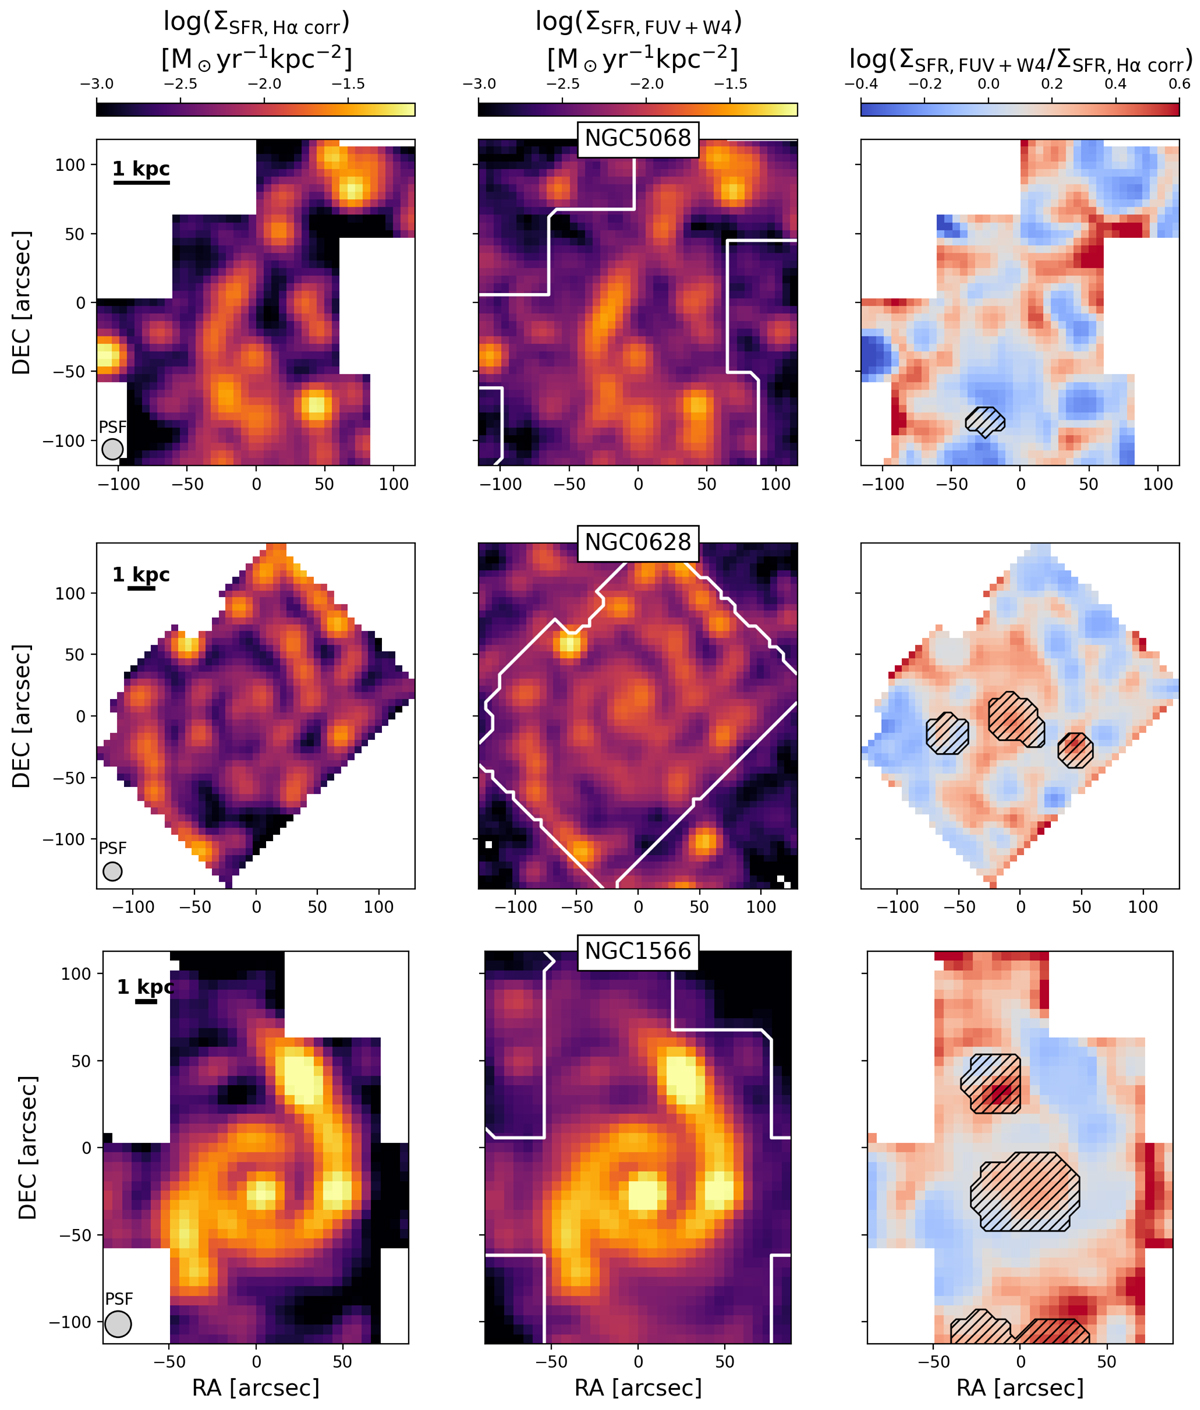
Comparison between ΣSFR/(M⊙ kpc−2 yr−1) estimates at 15″ resolution from extinction-corrected Hα emission and UV+IR (FUV + W4) using the Leroy et al. (2019) prescription for three example galaxies. The maps are shown on the original pixel size of 5![]() 5, even though the analysis in this paper is based on sampling the data at ∼15″, and are scaled to the same level for ease of comparison. The white contours in the UV+IR-based map represent the boundary of the MUSE mosaics. The right column shows the difference between the two SFR estimates in dex (the average uncertainty in the measured ratio due to the error in the fluxes is 0.03 dex). The hatched regions represent masked areas, namely regions contaminated by foreground stars and the AGN in NGC 1566.
5, even though the analysis in this paper is based on sampling the data at ∼15″, and are scaled to the same level for ease of comparison. The white contours in the UV+IR-based map represent the boundary of the MUSE mosaics. The right column shows the difference between the two SFR estimates in dex (the average uncertainty in the measured ratio due to the error in the fluxes is 0.03 dex). The hatched regions represent masked areas, namely regions contaminated by foreground stars and the AGN in NGC 1566.
Current usage metrics show cumulative count of Article Views (full-text article views including HTML views, PDF and ePub downloads, according to the available data) and Abstracts Views on Vision4Press platform.
Data correspond to usage on the plateform after 2015. The current usage metrics is available 48-96 hours after online publication and is updated daily on week days.
Initial download of the metrics may take a while.