Fig. 8.
Download original image
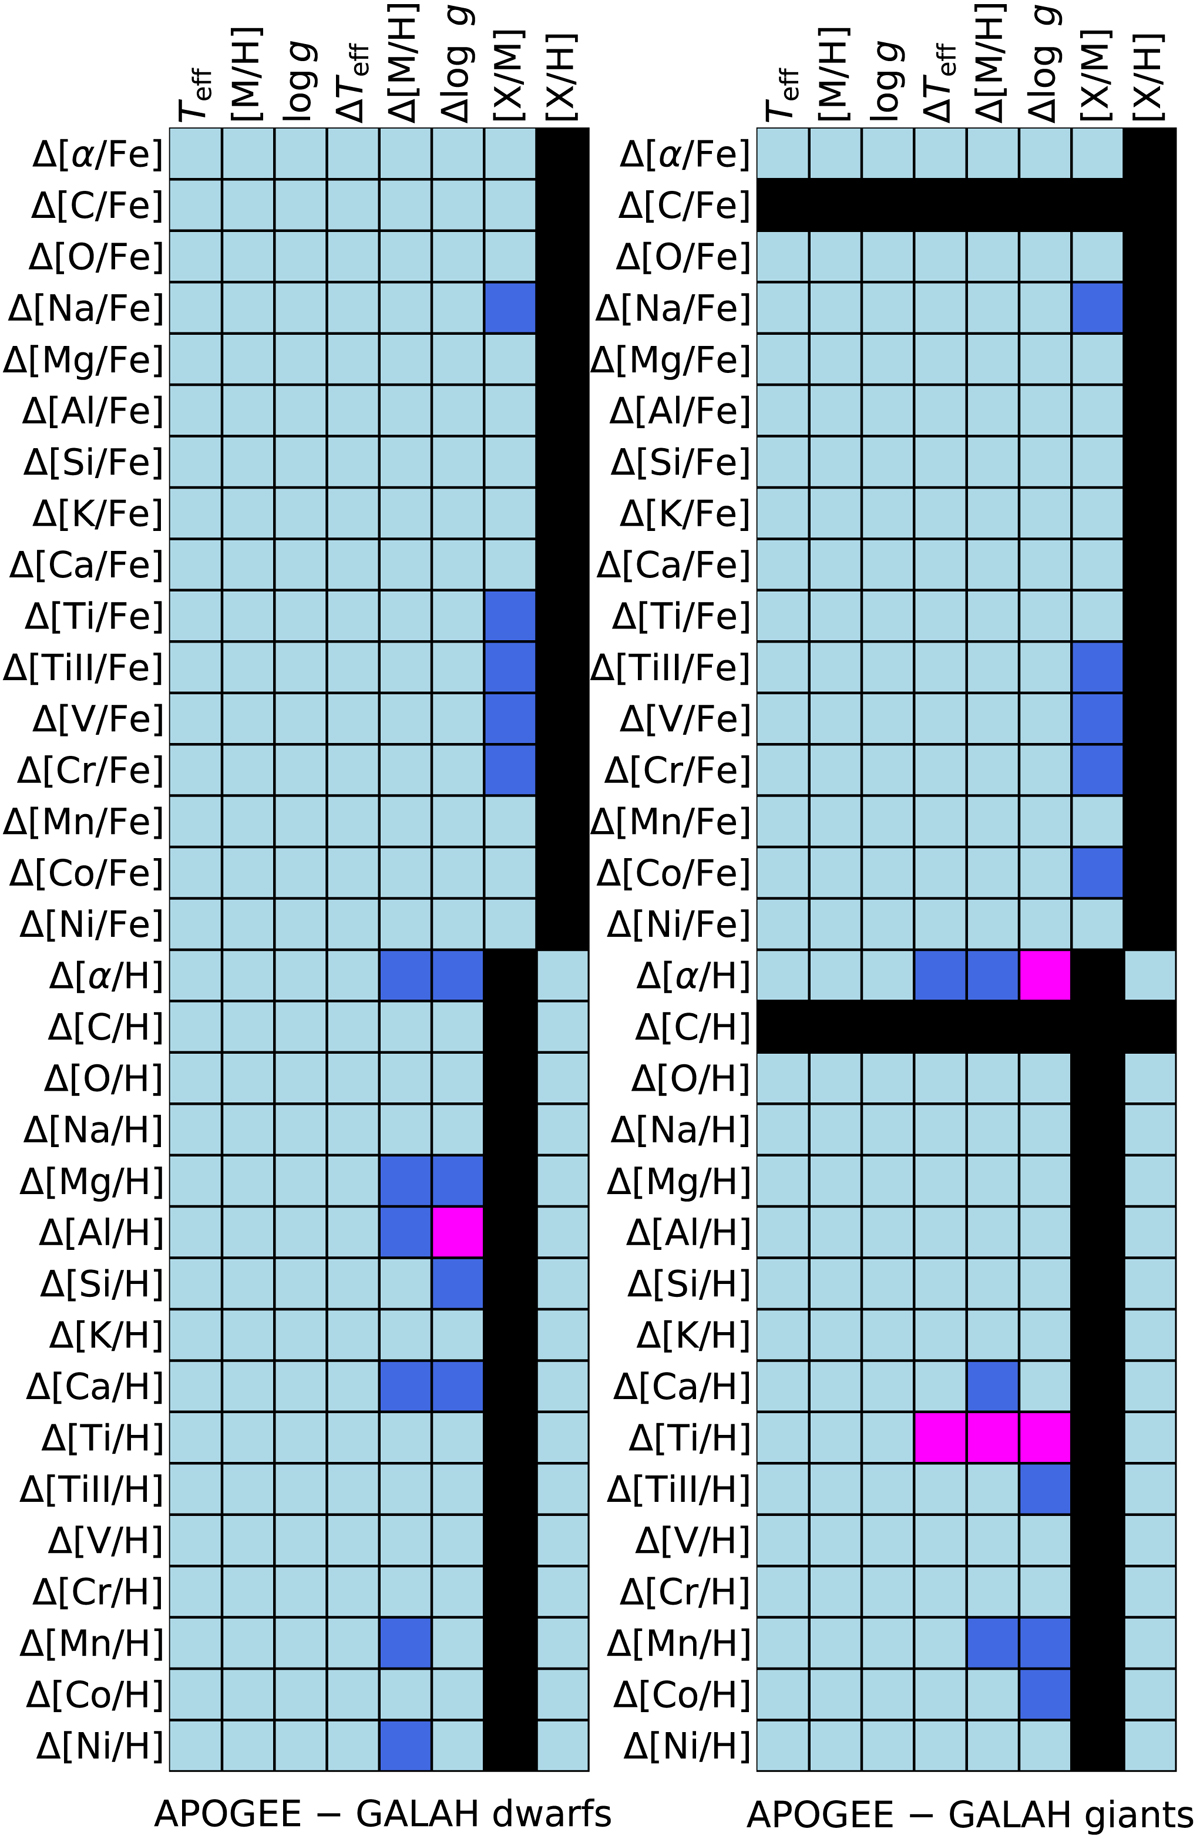
Strength of correlations in the APOGEE−GALAH parameter and abundance pairs. The color-coding is as follows: Black cells are indeterminable, light blue cells represent no significant correlation (< 0.8σ), dark blue cells indicate a weak correlation (0.8σ − 1.5σ), and the magenta cells mean strong correlation (> 1.5σ). Our estimations are based on the average correlation of reported individual uncertainties of stellar parameters and abundances. Dwarf (left panel) and giant stars (right panel) are separated.
Current usage metrics show cumulative count of Article Views (full-text article views including HTML views, PDF and ePub downloads, according to the available data) and Abstracts Views on Vision4Press platform.
Data correspond to usage on the plateform after 2015. The current usage metrics is available 48-96 hours after online publication and is updated daily on week days.
Initial download of the metrics may take a while.