Fig. 5.
Download original image
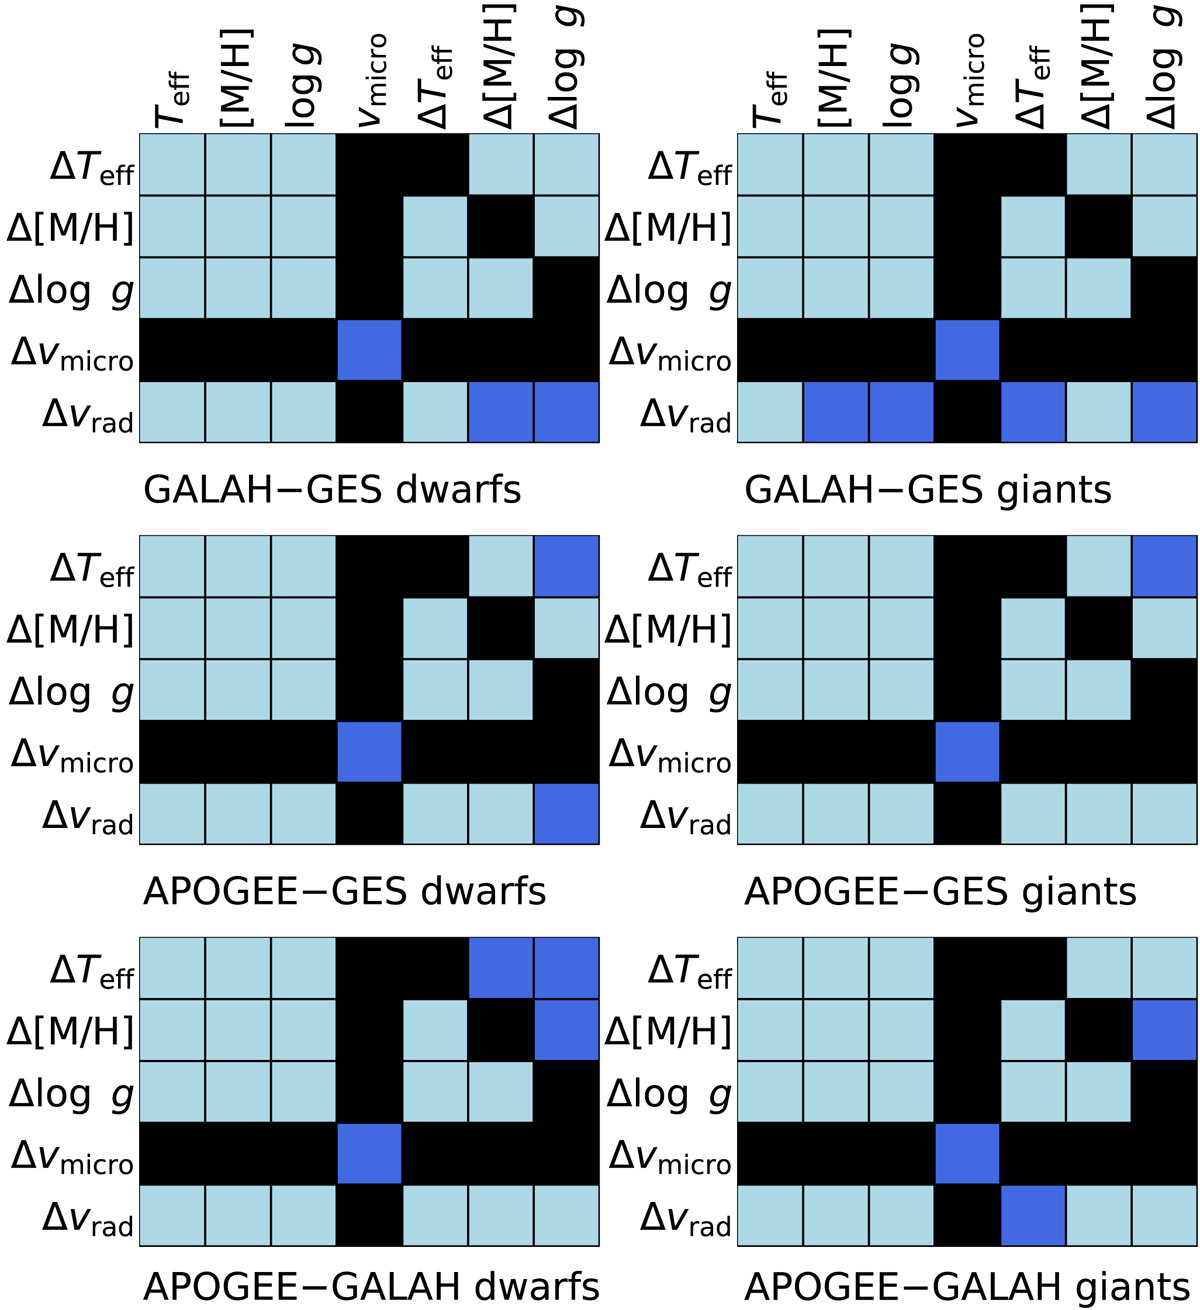
Correlations between the main parameter pairs in the three overlapping catalogs. The strength of the correlations between each pair is color-coded: light blue cells represent no significant correlations (< 0.8σ); dark blue cells represent weak correlations (0.8σ − 1.5σ). Black cells are not relevant due to the absence of reported uncertainties of vmicro or because they link the same quantities (e.g., ΔTeff with ΔTeff). The estimated strength of the correlations is based on the comparison of the correlation slopes with the average of the reported individual uncertainties of stellar parameters and RVs. The stars have been separated into dwarfs (left column) and giants (right column).
Current usage metrics show cumulative count of Article Views (full-text article views including HTML views, PDF and ePub downloads, according to the available data) and Abstracts Views on Vision4Press platform.
Data correspond to usage on the plateform after 2015. The current usage metrics is available 48-96 hours after online publication and is updated daily on week days.
Initial download of the metrics may take a while.