Open Access
Fig. 2.
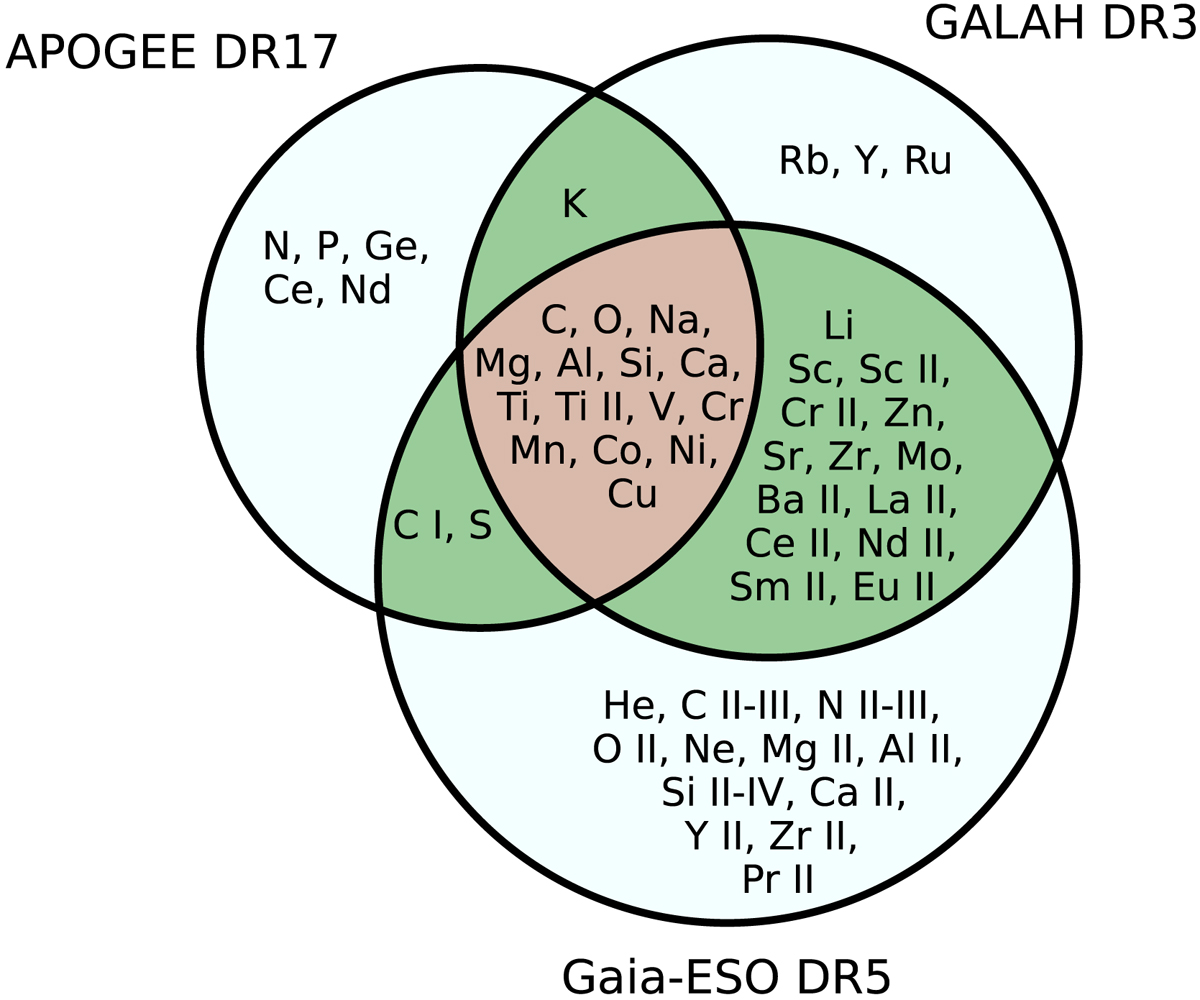
Download original image
Venn diagram of the elements derived by each survey. The overlap of elements in all three surveys is in brown and those from only two surveys in dark green. Light green indicates no overlap between surveys. Species of any intersection are discussed in detail in Sect. 6.
Current usage metrics show cumulative count of Article Views (full-text article views including HTML views, PDF and ePub downloads, according to the available data) and Abstracts Views on Vision4Press platform.
Data correspond to usage on the plateform after 2015. The current usage metrics is available 48-96 hours after online publication and is updated daily on week days.
Initial download of the metrics may take a while.