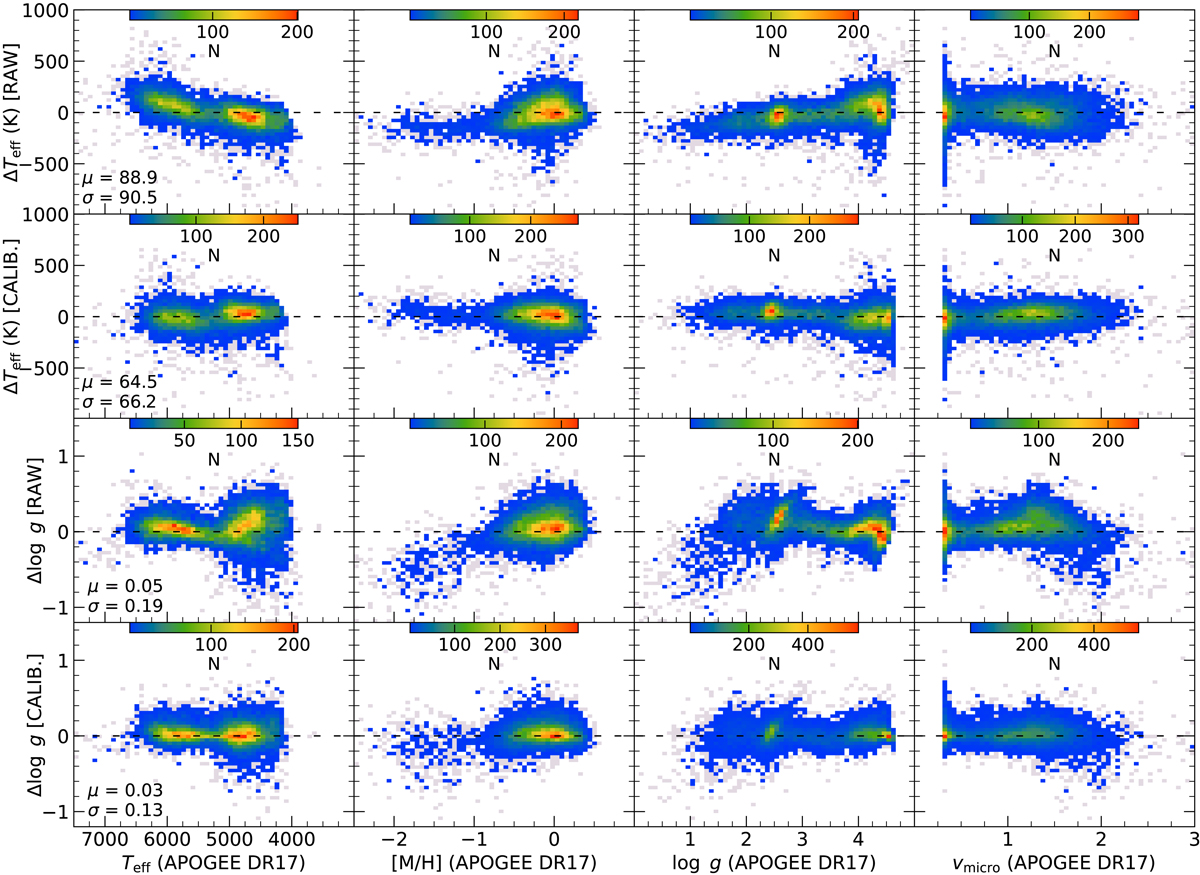
Fig. 13.
Download original image
Main parameters vs. Teff and log g discrepancies based on raw (first and third rows) and calibrated (second and fourth rows) values from the APOGEE−GALAH common data set. Horizontal axes indicate APOGEE DR17 data in all panels. Every data point is marked in the parameter planes, while the color-coding of stellar density starts from number two. The mean and standard deviation of the differences are also shown in each case.
Current usage metrics show cumulative count of Article Views (full-text article views including HTML views, PDF and ePub downloads, according to the available data) and Abstracts Views on Vision4Press platform.
Data correspond to usage on the plateform after 2015. The current usage metrics is available 48-96 hours after online publication and is updated daily on week days.
Initial download of the metrics may take a while.