Fig. 11.
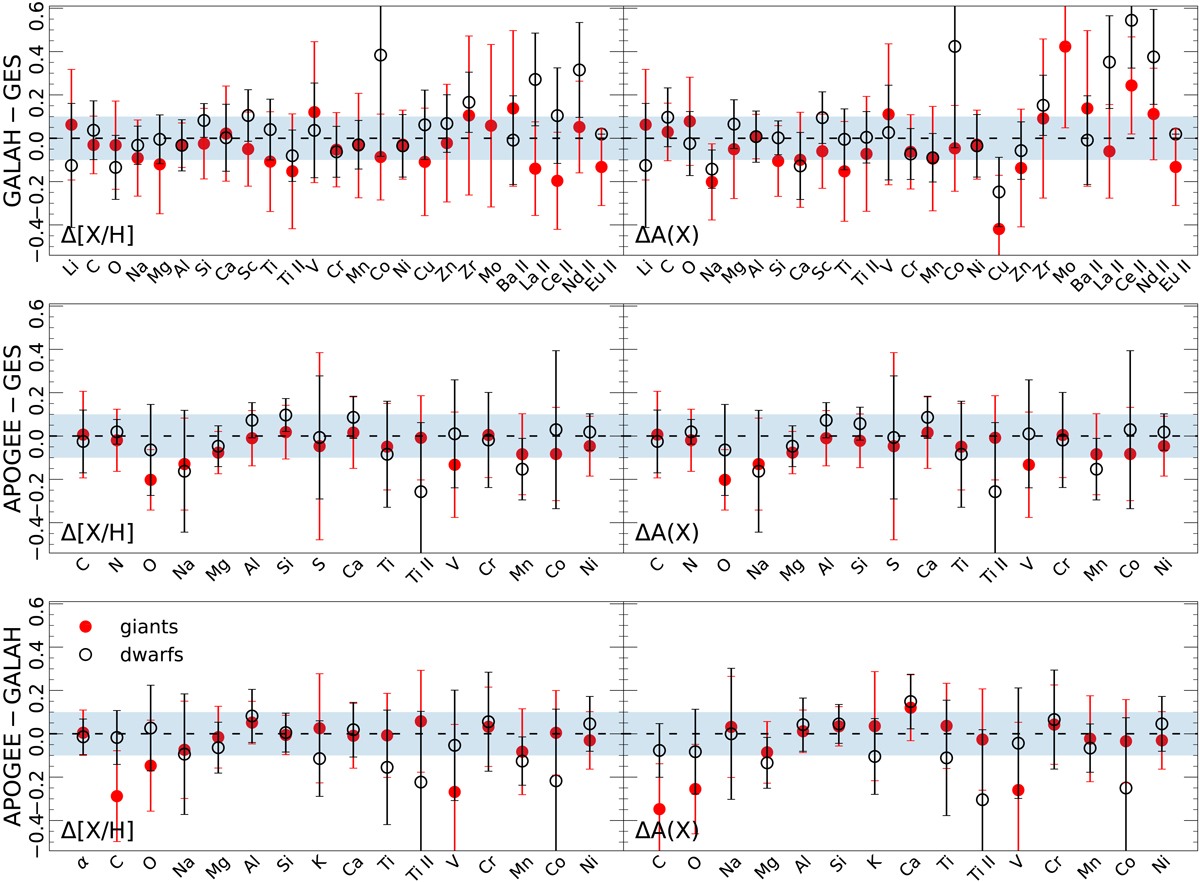
Download original image
Individual elemental abundance differences for APOGEE−GALAH (bottom), APOGEE−GES (middle), and GALAH−GES (top) common samples relative to hydrogen (left column) and on an absolute scale (right column). The shaded interval accounts for a ±0.1 dex range. The calculated results for GB and MS stars are shown as filled red and empty black circles, respectively.
Current usage metrics show cumulative count of Article Views (full-text article views including HTML views, PDF and ePub downloads, according to the available data) and Abstracts Views on Vision4Press platform.
Data correspond to usage on the plateform after 2015. The current usage metrics is available 48-96 hours after online publication and is updated daily on week days.
Initial download of the metrics may take a while.