Fig. 10.
Download original image
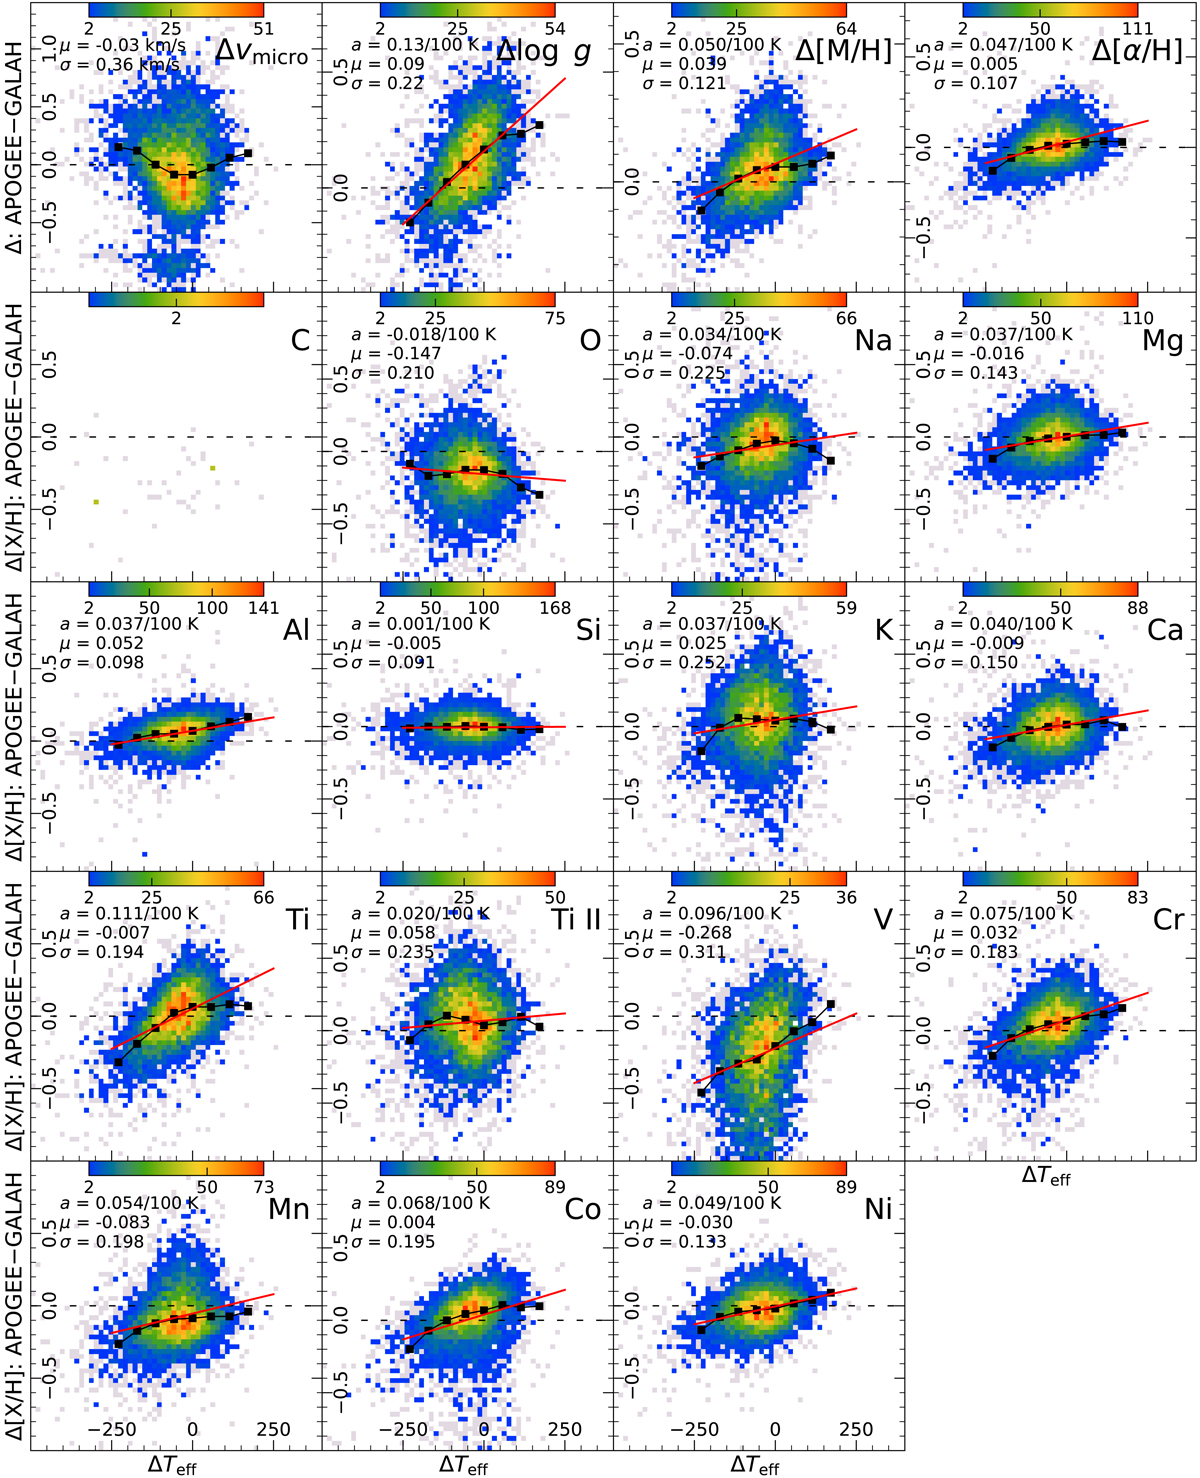
Distributions of Δvmicro (km s−1), Δlog g (dex), Δ[M/H], and Δ[X/H] abundance discrepancies with respect to ΔTeff for RGB stars common between the APOGEE and GALAH quality data sets. The color-coding indicates the number of stars in the parameter planes, and bins representing one star are shown in gray. Black squares represent the median value within 50 K ranges. Red lines, with a slope of a, are fitted on the individual data points. The mean of the parameter differences (μ) and the standard deviations (σ) are displayed in the top left corner of each panel.
Current usage metrics show cumulative count of Article Views (full-text article views including HTML views, PDF and ePub downloads, according to the available data) and Abstracts Views on Vision4Press platform.
Data correspond to usage on the plateform after 2015. The current usage metrics is available 48-96 hours after online publication and is updated daily on week days.
Initial download of the metrics may take a while.