Open Access
Fig. 1.
Download original image
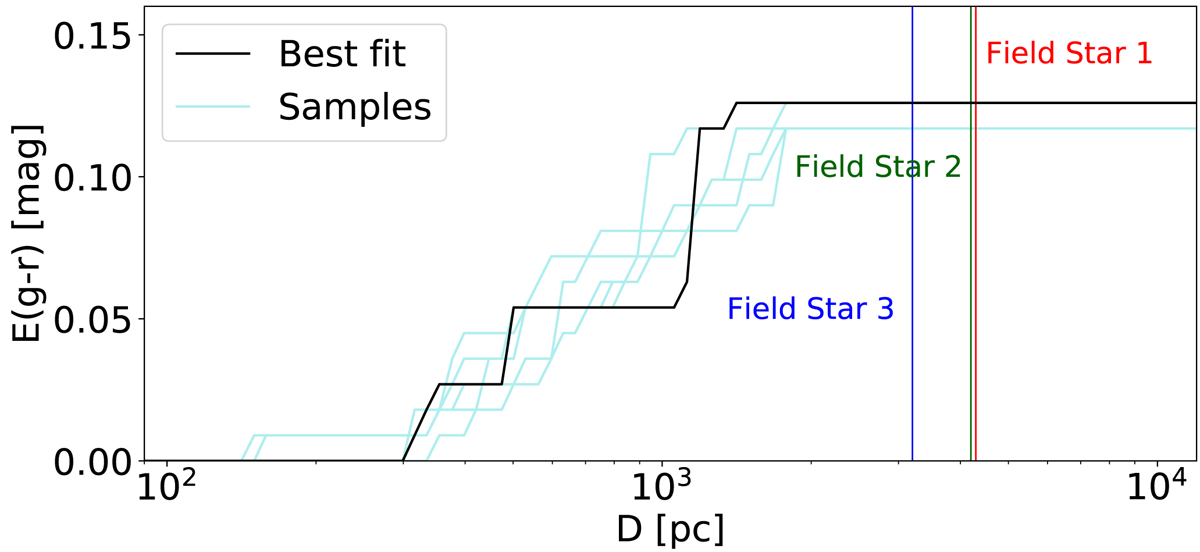
Reddening (g − r) as a function of distance along the line of sight of the GRB, as compiled by Green et al. (2019). The vertical lines denote the distance of the three field stars used for ISP estimation. The black line represents the maximum-probability density estimate of the distance-reddening curve.
Current usage metrics show cumulative count of Article Views (full-text article views including HTML views, PDF and ePub downloads, according to the available data) and Abstracts Views on Vision4Press platform.
Data correspond to usage on the plateform after 2015. The current usage metrics is available 48-96 hours after online publication and is updated daily on week days.
Initial download of the metrics may take a while.