Fig. 8.
Download original image
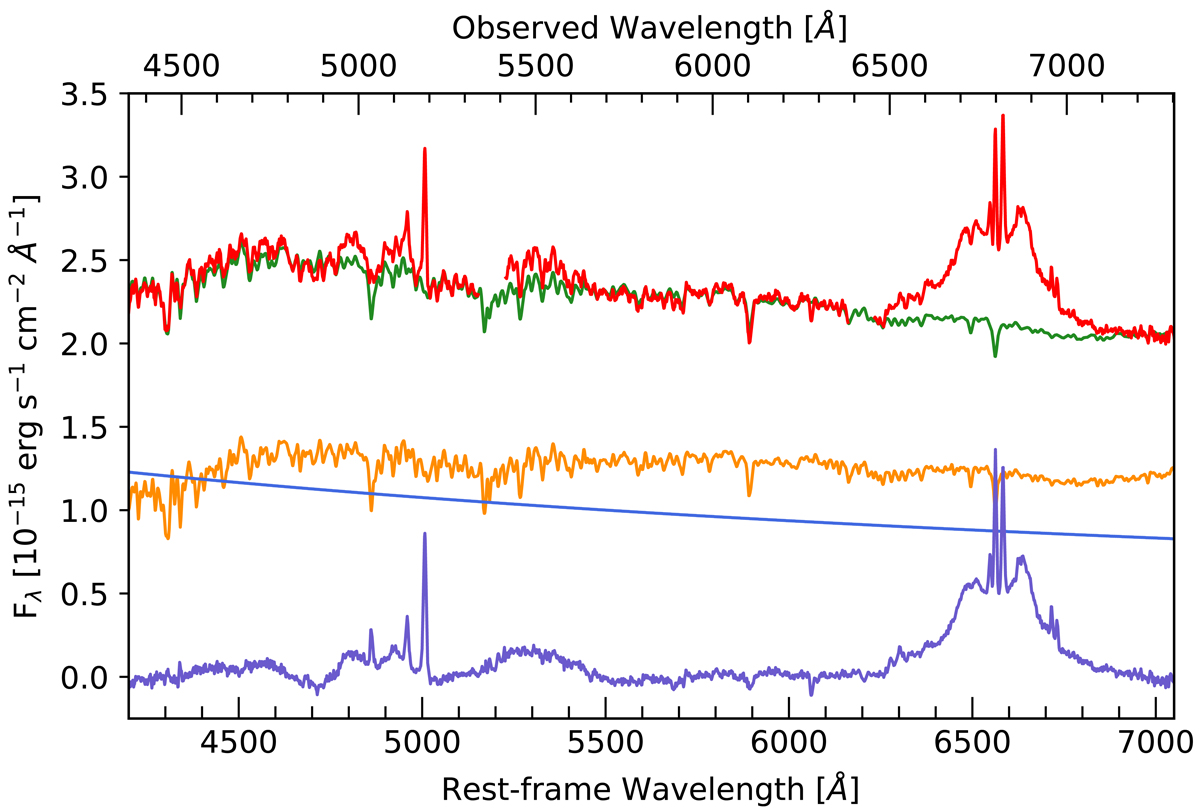
Observed spectrum of IRAS 23226-3843 taken on 2019 September 24 (red) and synthesis fit with pPXF. The green line is the combined pPXF fit for the stellar component (orange) and the additional power-law component (light blue). The residuum spectrum (purple) i.e., the difference between the observed spectrum and the combined pPXF fit, gives the clean emission line contribution.
Current usage metrics show cumulative count of Article Views (full-text article views including HTML views, PDF and ePub downloads, according to the available data) and Abstracts Views on Vision4Press platform.
Data correspond to usage on the plateform after 2015. The current usage metrics is available 48-96 hours after online publication and is updated daily on week days.
Initial download of the metrics may take a while.