Fig. 7.
Download original image
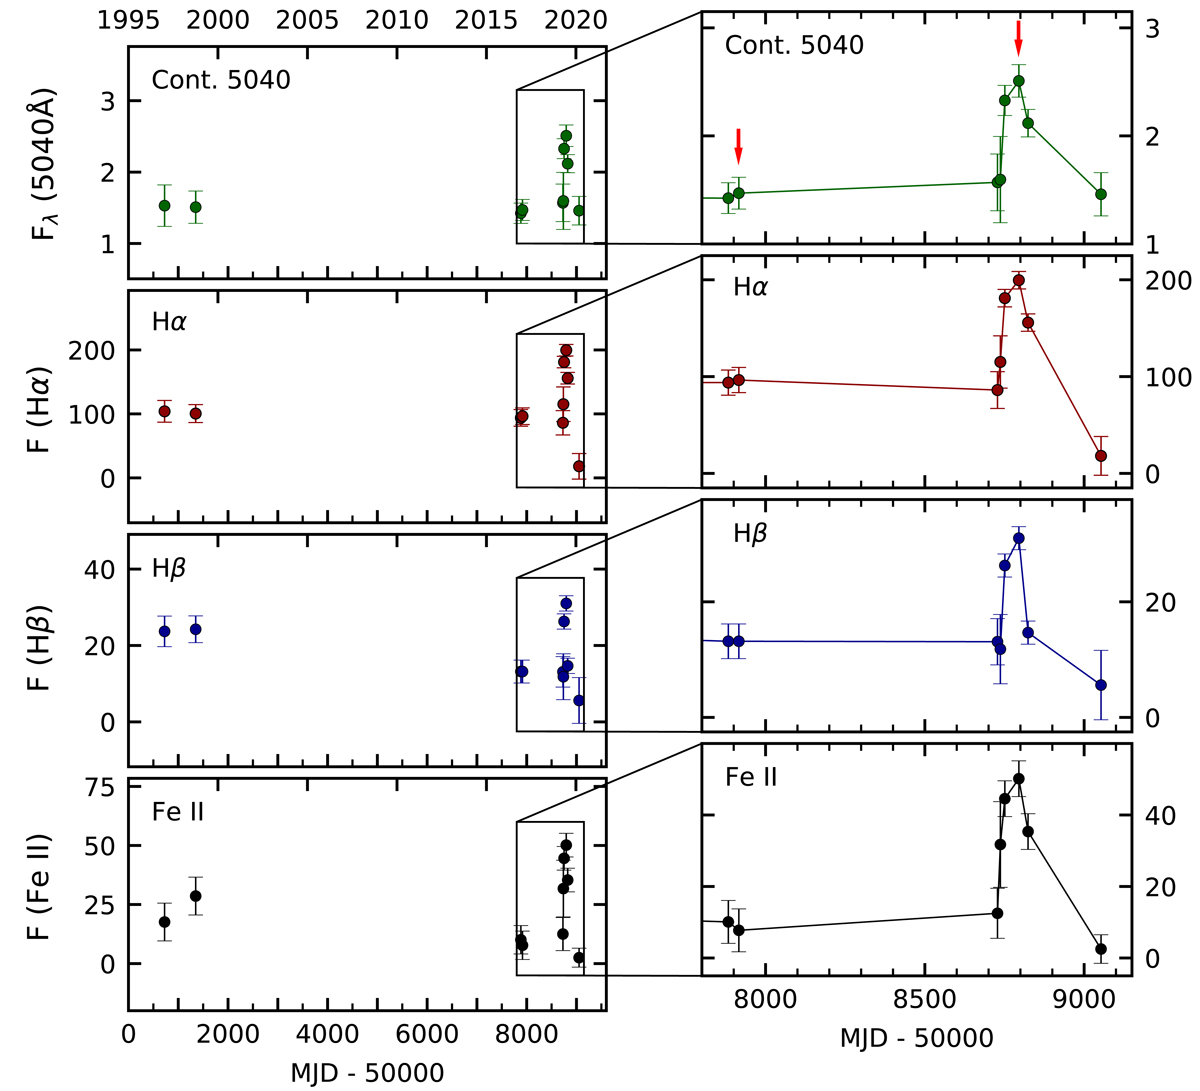
Long-term light curves of the continuum flux density at 5040 Å (in units of 10−15 erg s−1 cm−2 Å−1), as well as of the line fluxes of Hα, Hβ, and Fe II(42,48,49) (in units 10−15 erg s−1 cm−2) for the years 1997 until 2020. The right panel shows, in addition to the observations from 2017 and 2020 the variations in 2019 in more detail. The epochs of the deep XMM-Newton observations are indicated by a red arrow.
Current usage metrics show cumulative count of Article Views (full-text article views including HTML views, PDF and ePub downloads, according to the available data) and Abstracts Views on Vision4Press platform.
Data correspond to usage on the plateform after 2015. The current usage metrics is available 48-96 hours after online publication and is updated daily on week days.
Initial download of the metrics may take a while.