Open Access
Fig. 3.
Download original image
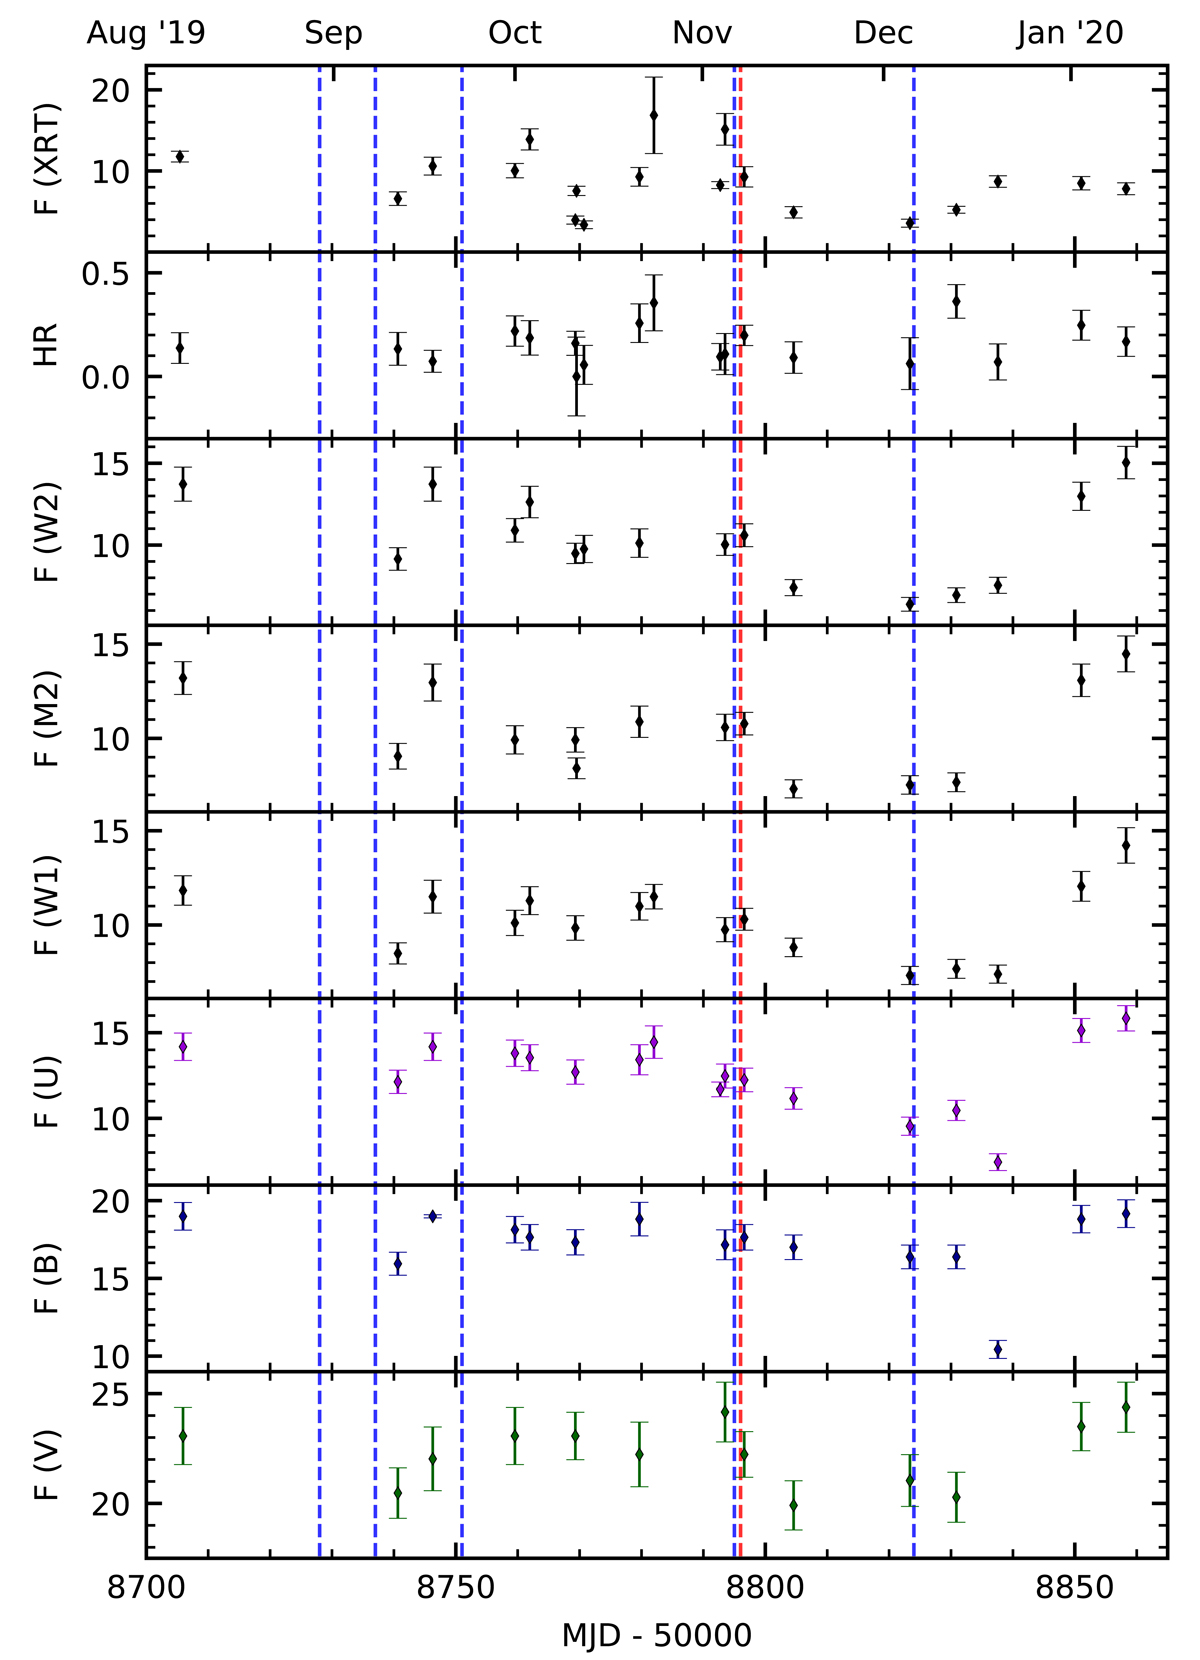
Combined X-ray, UV, and optical light curves taken with the Swift satellite for the year 2019. The fluxes are given in units of 10−12 ergs s−1 cm−2. Furthermore, the dates of our optical spectral observations are indicated as blue lines. We note that the deep XMM-Newton observation was performed on MJD 58795 (red line).
Current usage metrics show cumulative count of Article Views (full-text article views including HTML views, PDF and ePub downloads, according to the available data) and Abstracts Views on Vision4Press platform.
Data correspond to usage on the plateform after 2015. The current usage metrics is available 48-96 hours after online publication and is updated daily on week days.
Initial download of the metrics may take a while.