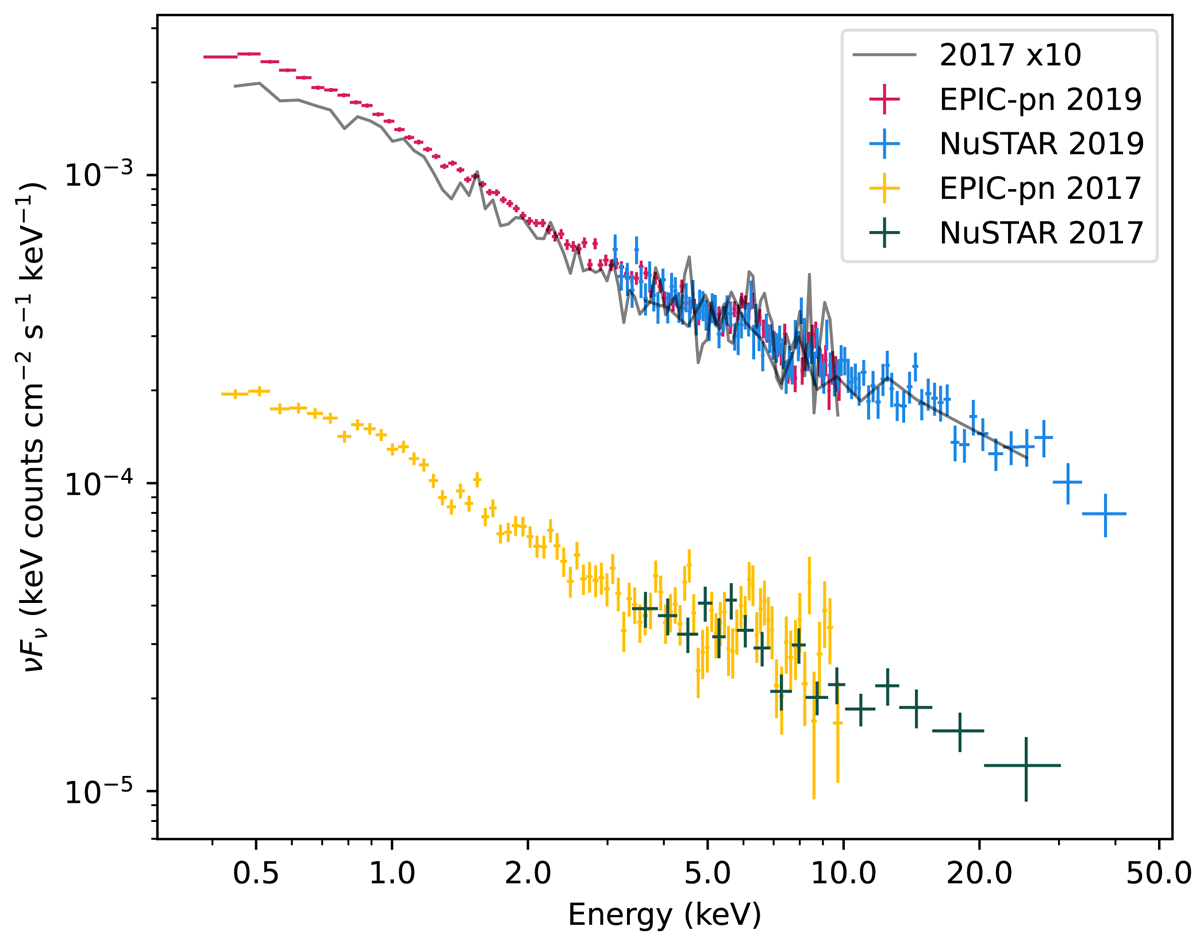
Fig. 12.
Download original image
Comparison of the broadband X-ray data in 2017 and 2019. The change in flux is a uniform increase of a factor of ∼10 across the bandpass, and both spectra show residuals in the Fe K band. All spectra are corrected for the instrumental effective area. The gray line shows the 2017 data scaled up by a factor of 10 to match the 2019 data. Above ∼3 keV the agreement in spectral shape is very good, below 3 keV the 2019 data is relatively higher, with the difference increasing toward lower energies.
Current usage metrics show cumulative count of Article Views (full-text article views including HTML views, PDF and ePub downloads, according to the available data) and Abstracts Views on Vision4Press platform.
Data correspond to usage on the plateform after 2015. The current usage metrics is available 48-96 hours after online publication and is updated daily on week days.
Initial download of the metrics may take a while.