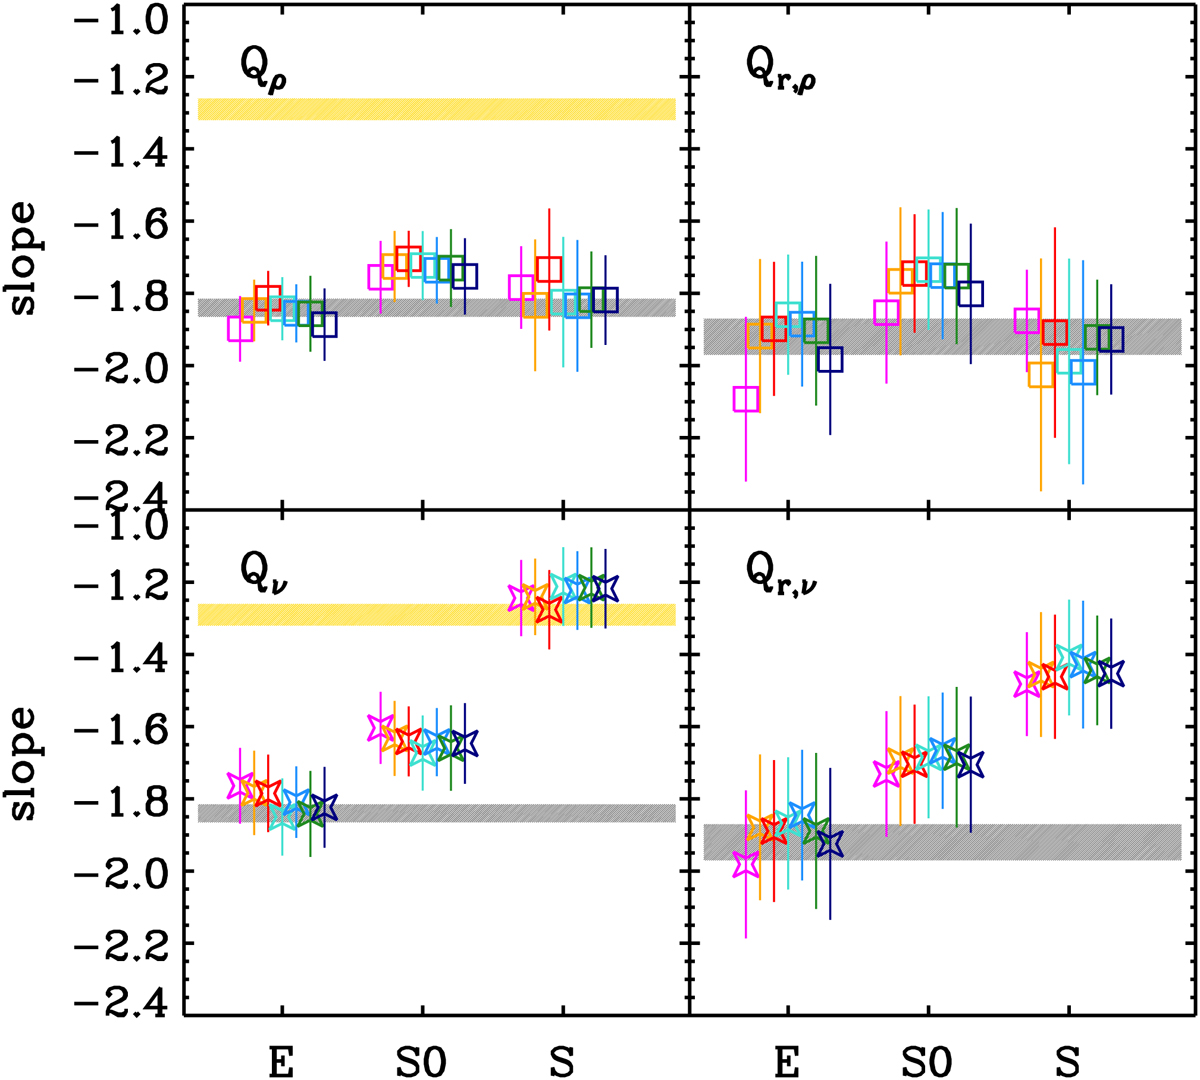
Fig. 5.
Download original image
Average and dispersion of the Q profile logarithmic slope and the simulation-based predictions for DM tracers (grey shading), −1.84 ± 0.025 for Q(r) and −1.92 ± 0.05 for Qr(r), and for subhalos (yellow shading), −1.29 ± 0.03, for different morphological classes (indicated on the x axis), in different models (color coded as in Fig. 2 and Table 1). Only linear (l ≥ 0.9) profiles are considered.
Current usage metrics show cumulative count of Article Views (full-text article views including HTML views, PDF and ePub downloads, according to the available data) and Abstracts Views on Vision4Press platform.
Data correspond to usage on the plateform after 2015. The current usage metrics is available 48-96 hours after online publication and is updated daily on week days.
Initial download of the metrics may take a while.