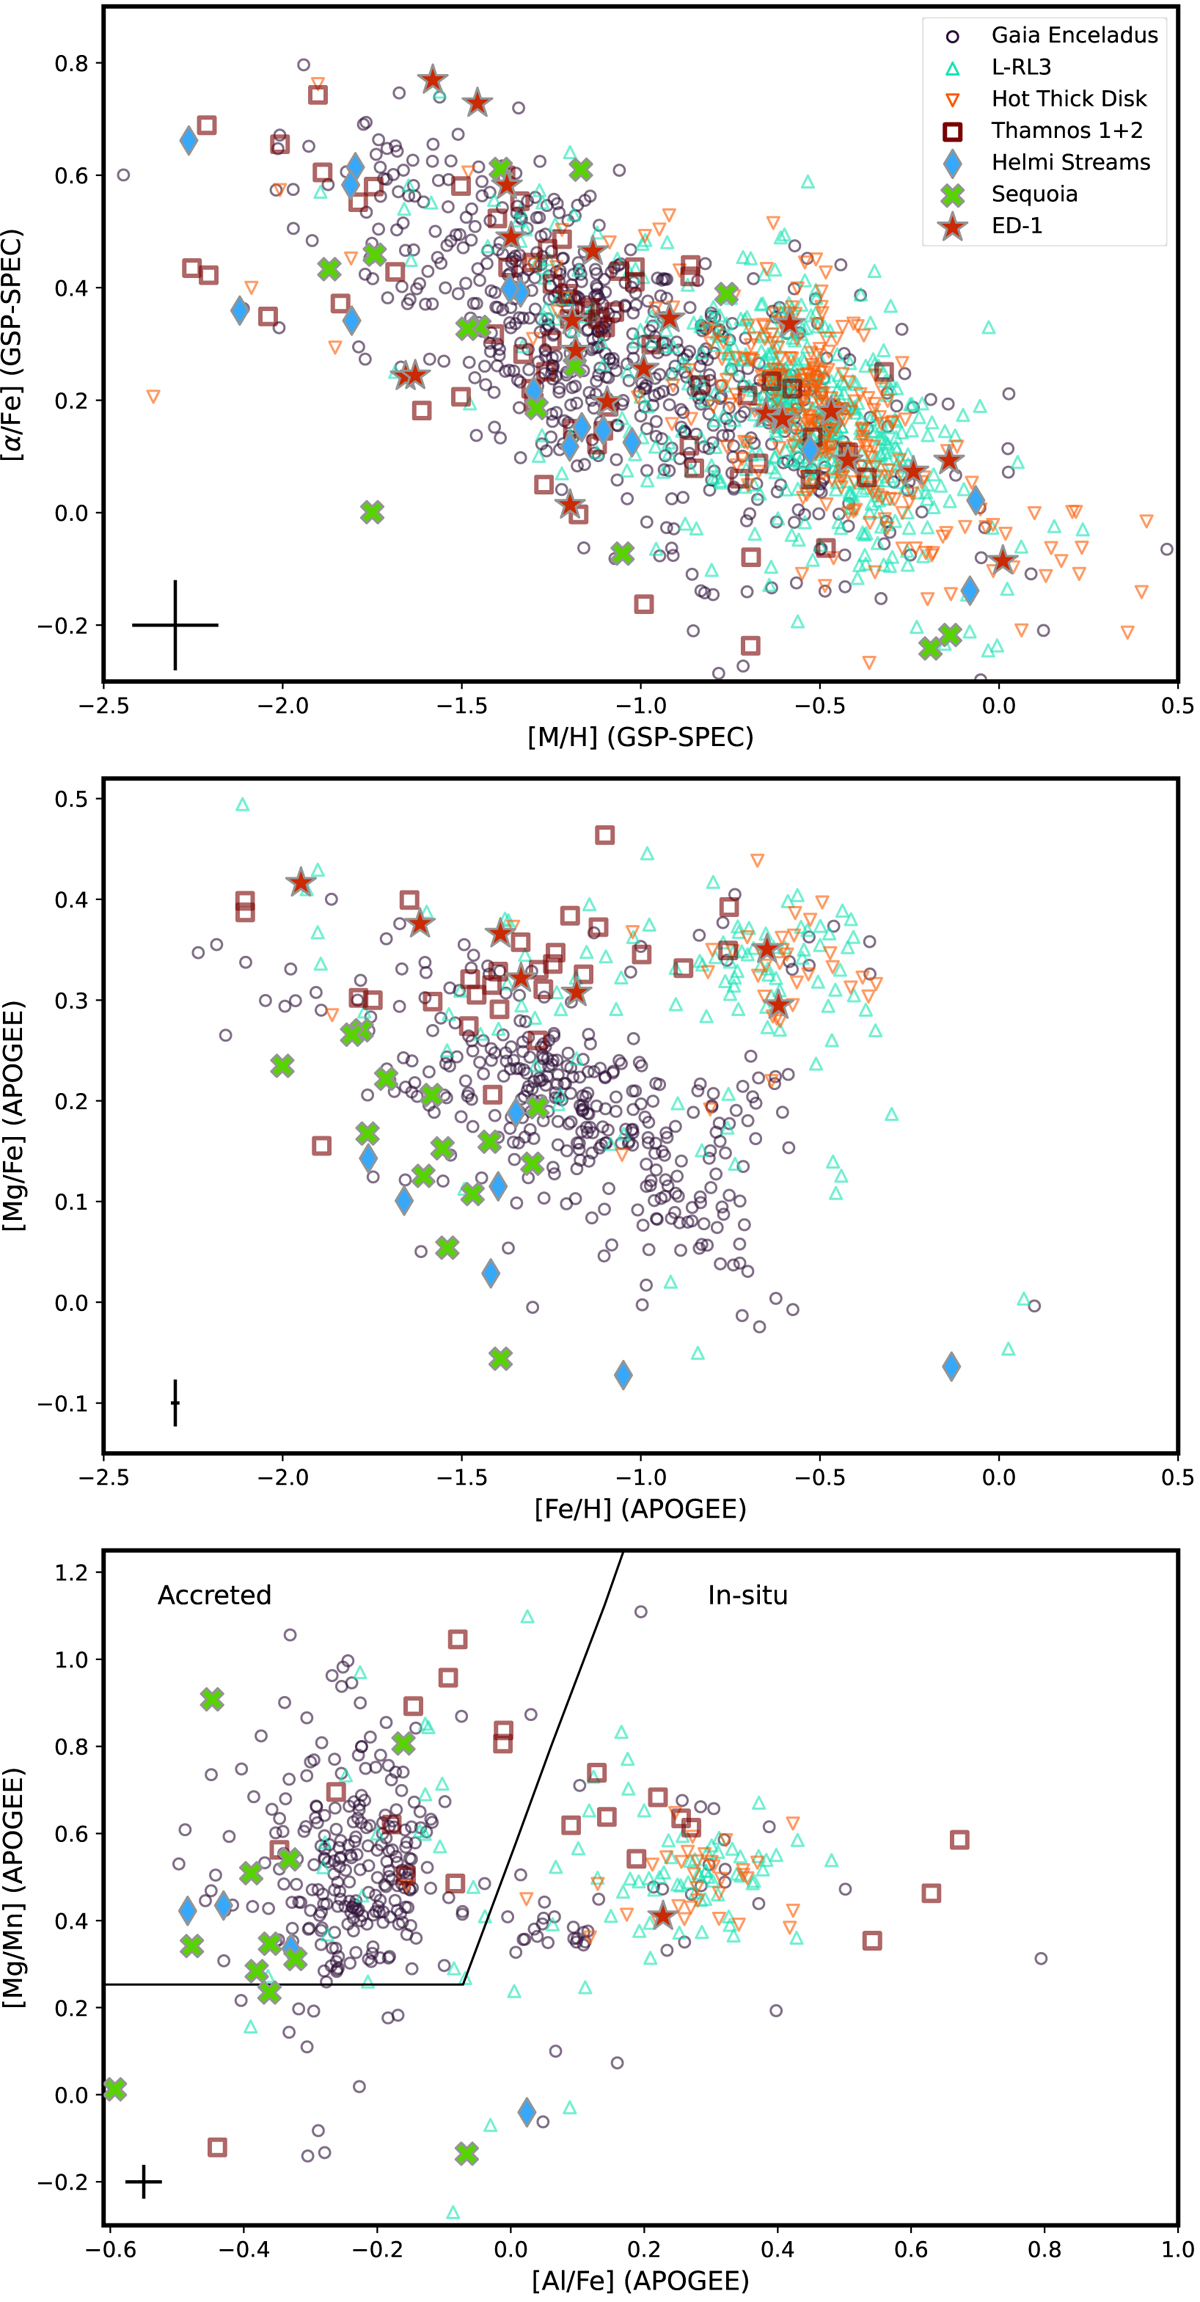
Fig. 5.
Download original image
Chemical abundances from GSP-SPEC (top) and APOGEE (bottom panels). The top two panels can be compared as they show [M/H] vs. [α/Fe] and [Fe/H] vs. [Mg/Fe]. The [α/Fe] from the GSP-SPEC abundances (top) are dominated by [Ca/Fe], for which the separation between the different populations is known to be less clear than for other α elements, e.g., [Mg/Fe] (see e.g., Nissen & Schuster 2011), which is what is shown for the APOGEE abundances (middle panel). The bottom panel showing [Al/Fe] vs. [Mg/Mn] is often used to separate accreted from in situ stars. The legend shows groups or individual large clusters identified in our analysis. The median uncertainties are shown by the black error bar in the bottom-left corner of each panel.
Current usage metrics show cumulative count of Article Views (full-text article views including HTML views, PDF and ePub downloads, according to the available data) and Abstracts Views on Vision4Press platform.
Data correspond to usage on the plateform after 2015. The current usage metrics is available 48-96 hours after online publication and is updated daily on week days.
Initial download of the metrics may take a while.