Fig. 4.
Download original image
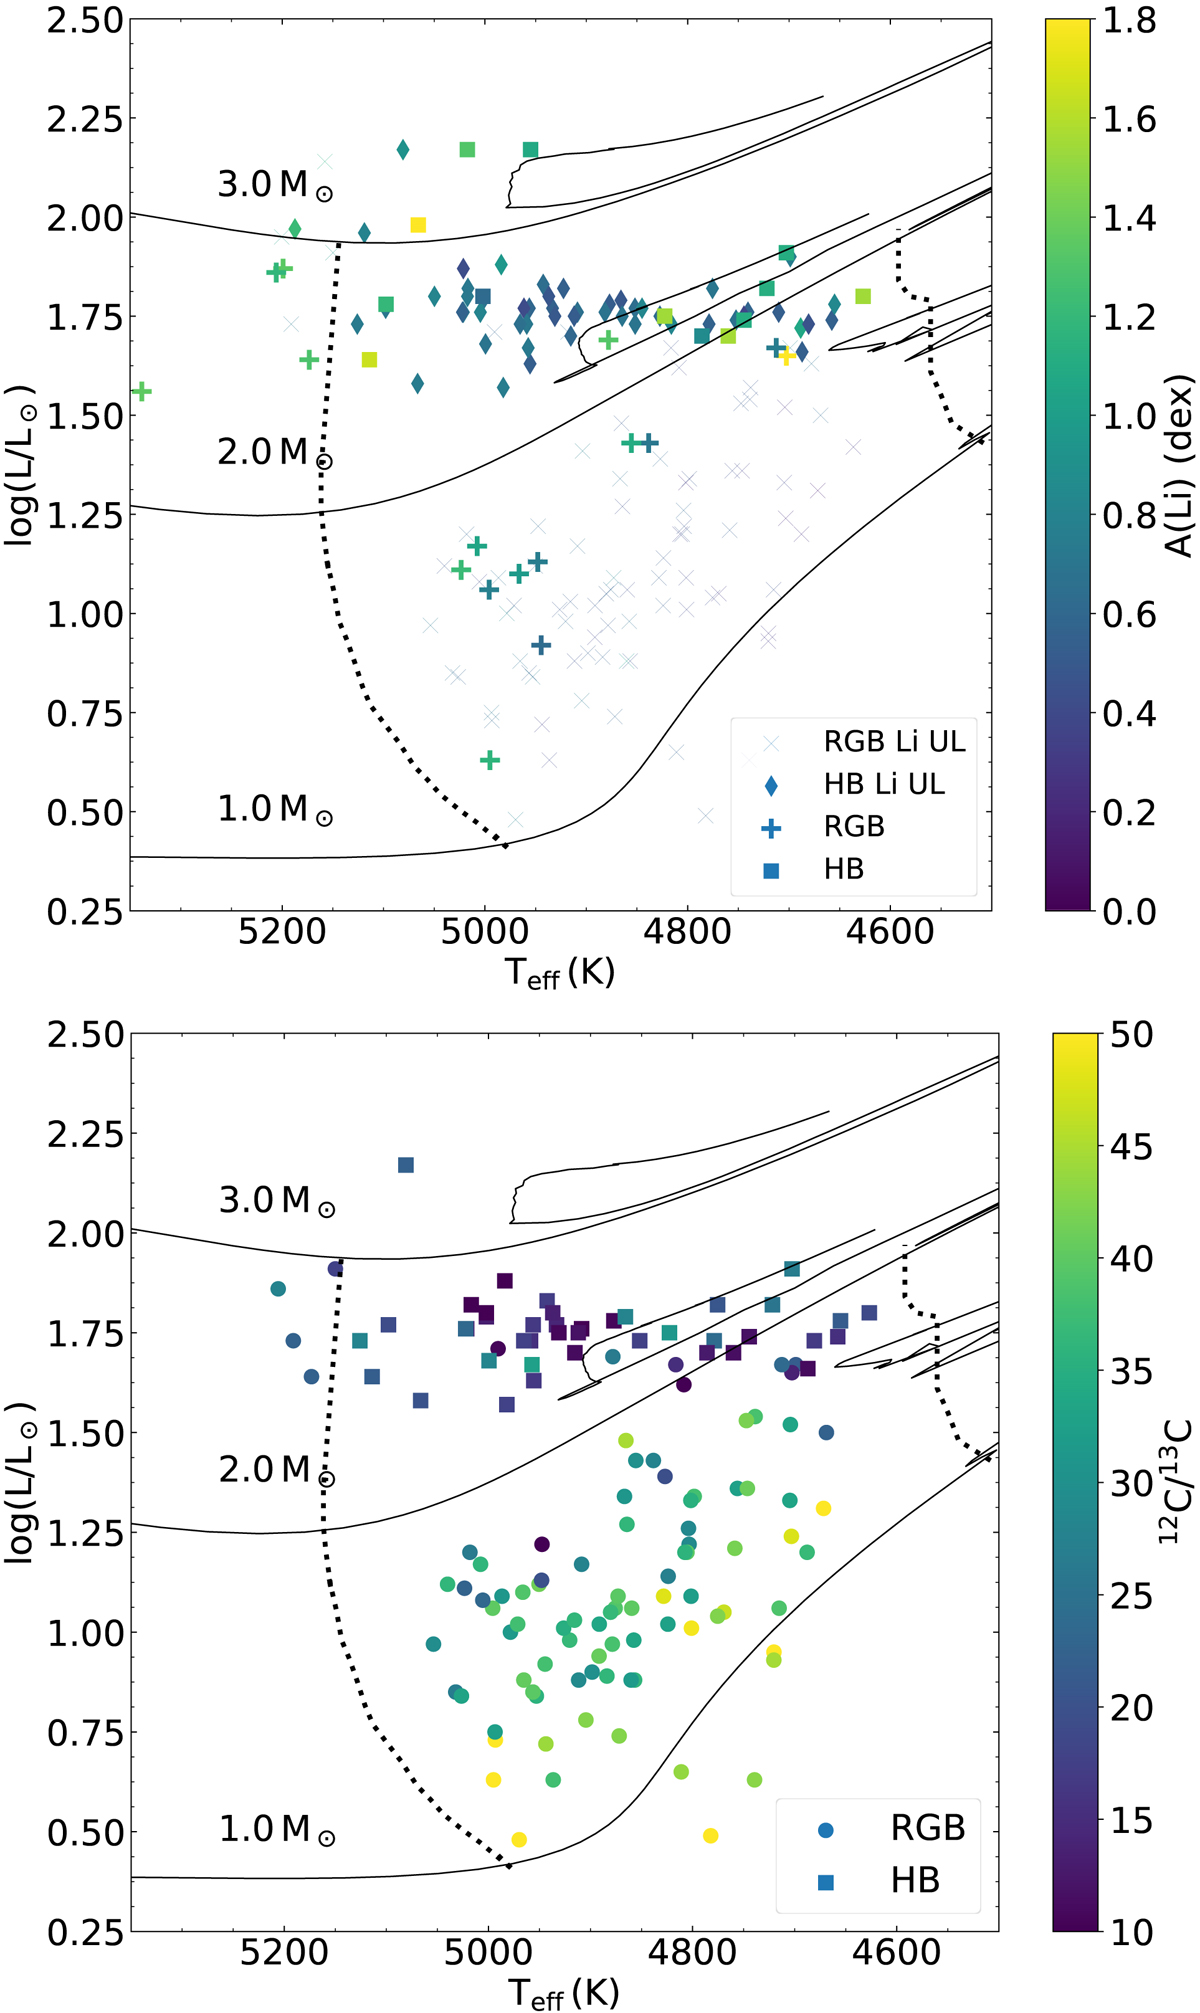
HR-diagram of sample stars. In the top (bottom) panel, they are color-coded by their A(Li) (12C/13C). Different symbols represent stars in different evolutionary stages. Top panel also includes different symbols for Li upper limits and measurements. MESA evolutionary tracks for solar-metallicity with different masses are included. The approximate position of the base of the RGB and luminosity bump is depicted with dotted lines. Note that the Li abundance of HIP3137 significantly exceeds the top of the color bar range.
Current usage metrics show cumulative count of Article Views (full-text article views including HTML views, PDF and ePub downloads, according to the available data) and Abstracts Views on Vision4Press platform.
Data correspond to usage on the plateform after 2015. The current usage metrics is available 48-96 hours after online publication and is updated daily on week days.
Initial download of the metrics may take a while.