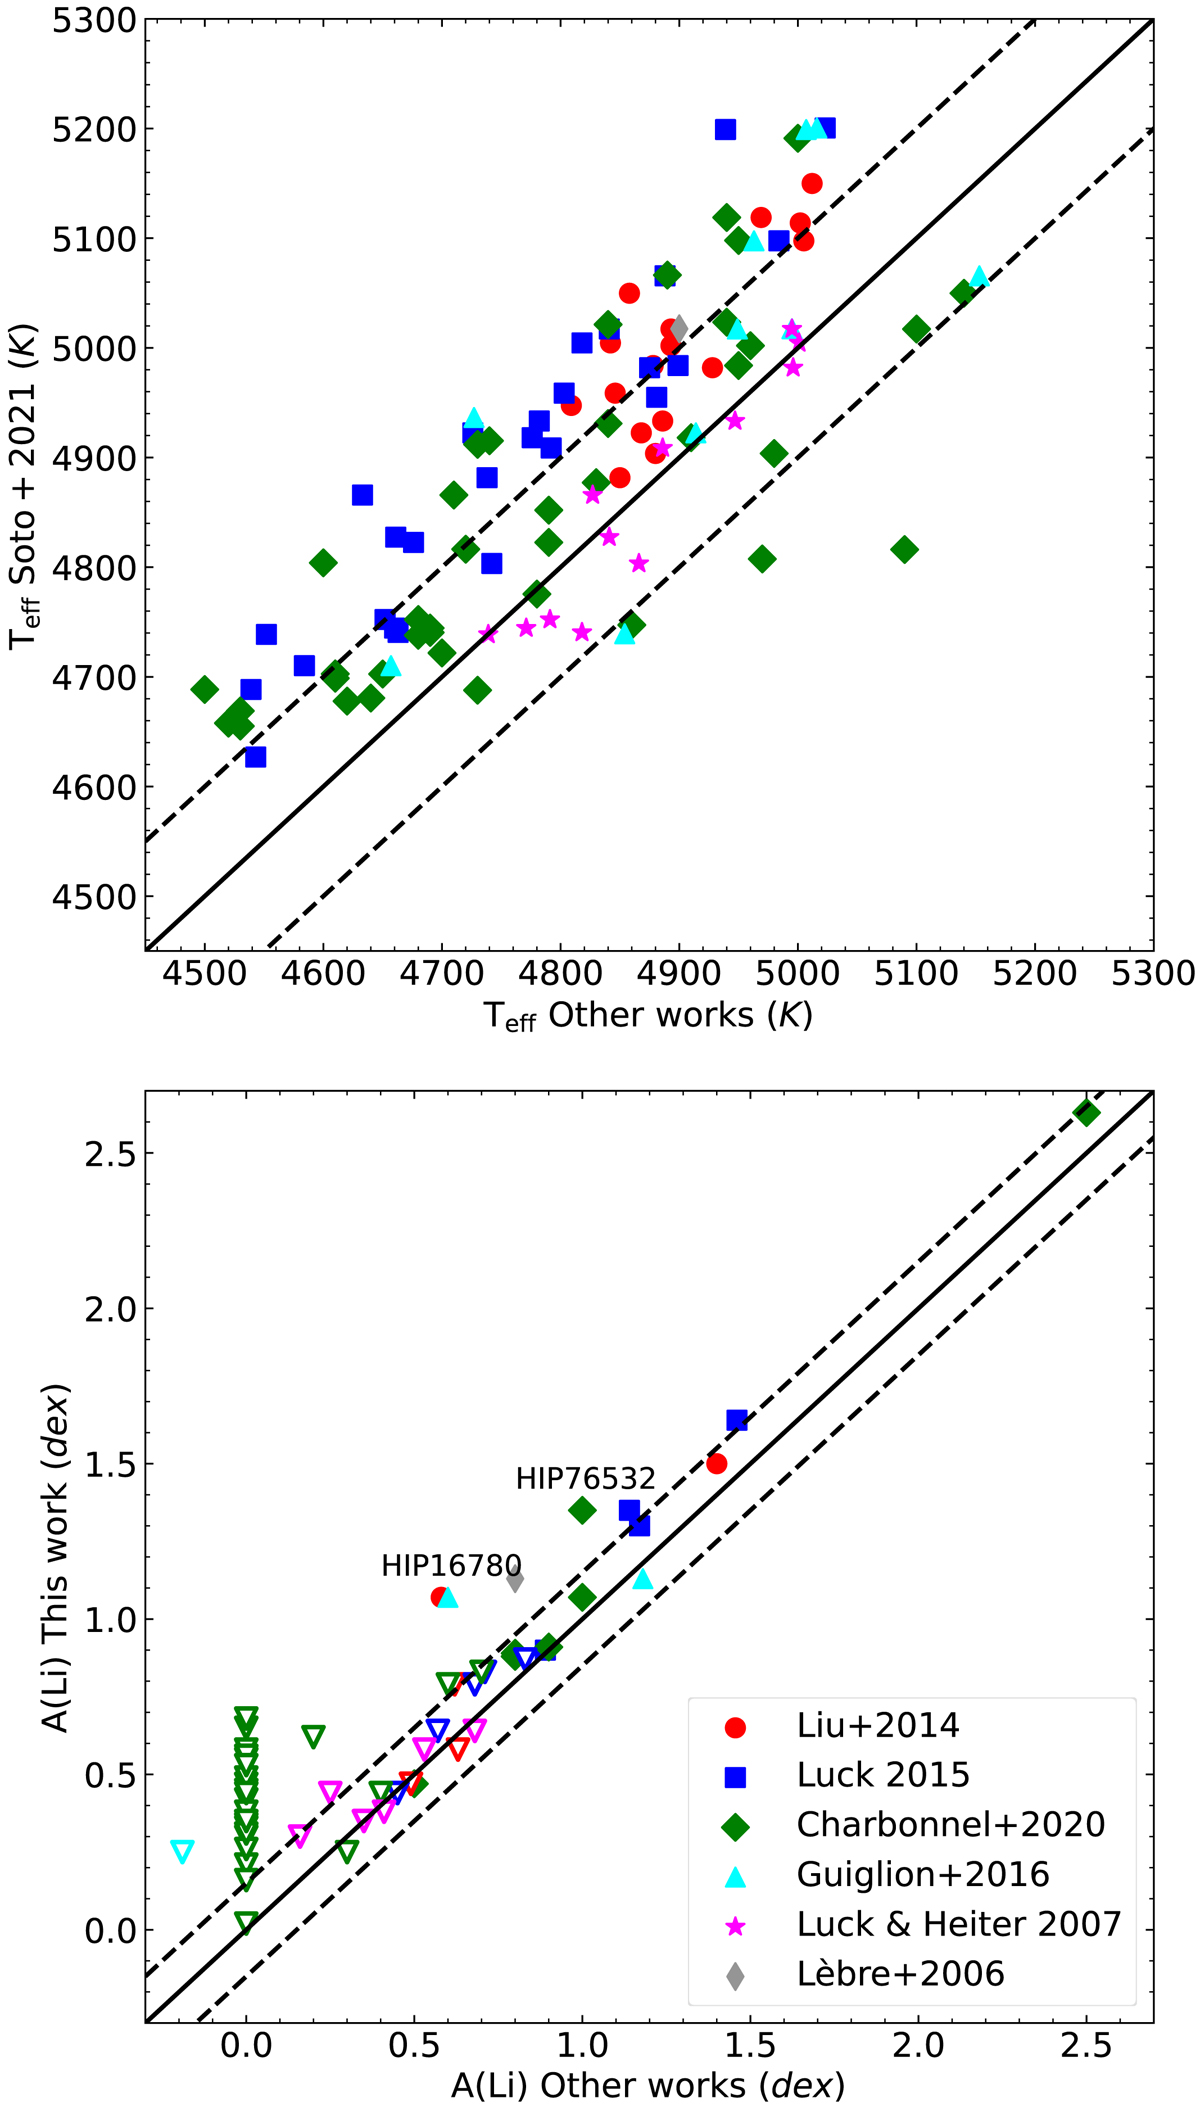
Fig. 3.
Download original image
Top: Comparisons in effective temperature between values used in this work to calculate abundances (Soto et al. 2021) and the catalogs of Liu et al. (2014; red circles), Luck (2015; blue squares), Guiglion et al. (2016; cyan triangles), and Charbonnel et al. (2020; green diamonds). Bottom: Comparison between measured Li abundances and reported values in those same studies. We include our upper limits (downward triangles) but remove upper limits from the literature. Dashed lines represent differences of 100 K in effective temperature and 0.15 dex in A(Li) from the 1 to 1 relation.
Current usage metrics show cumulative count of Article Views (full-text article views including HTML views, PDF and ePub downloads, according to the available data) and Abstracts Views on Vision4Press platform.
Data correspond to usage on the plateform after 2015. The current usage metrics is available 48-96 hours after online publication and is updated daily on week days.
Initial download of the metrics may take a while.