Open Access
Fig. 2.
Download original image
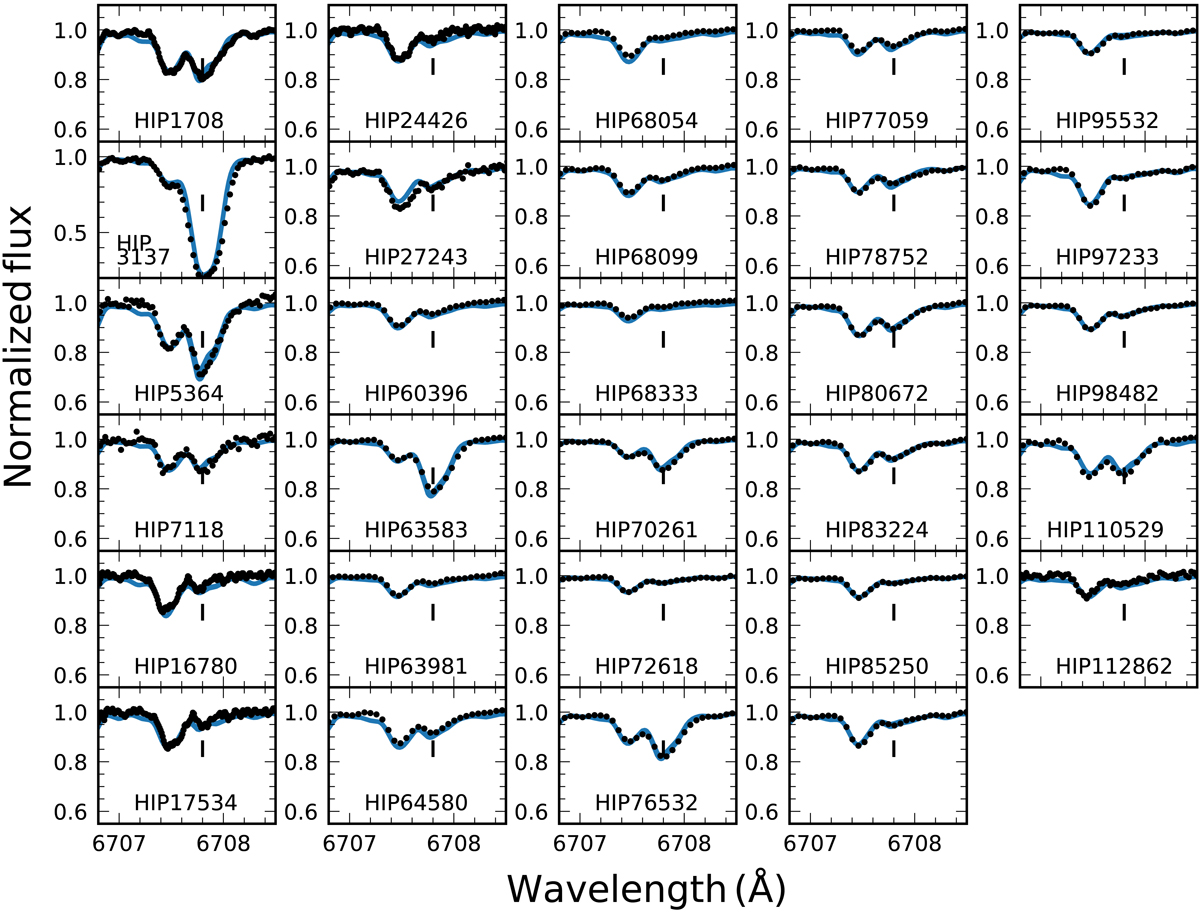
Fit of synthetic spectra (blue) to observations (black points) around the Li line, marked with a small vertical line in each panel, for the 29 detections in our sample. It is important to notice that the normalized flux range for the strong Li line in HIP3137 is different from all other fits.
Current usage metrics show cumulative count of Article Views (full-text article views including HTML views, PDF and ePub downloads, according to the available data) and Abstracts Views on Vision4Press platform.
Data correspond to usage on the plateform after 2015. The current usage metrics is available 48-96 hours after online publication and is updated daily on week days.
Initial download of the metrics may take a while.