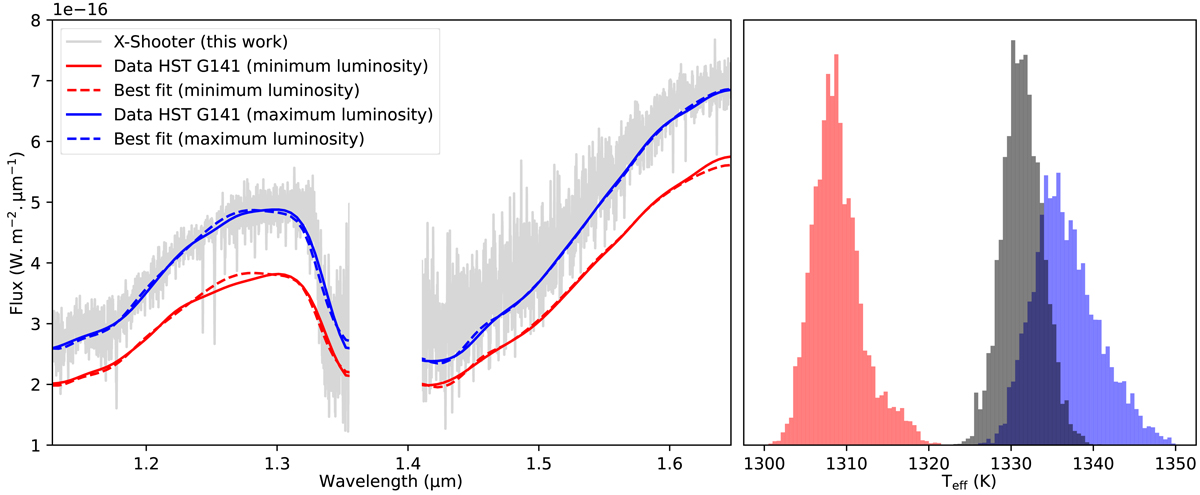
Fig. 3.
Download original image
Comparison with HST data. Left: ForMoSA fits (dash lines) of HST G141 data (solid lines). We used the maximum (blue) and minimum (red) amplitude data from the sequence of Bowler et al. (2020). We also compared these HST data with our X-shooter data. Right: comparison between Teff posteriors from the HST’s fits (red and blue) and the fit of our X-shooter data (gray).
Current usage metrics show cumulative count of Article Views (full-text article views including HTML views, PDF and ePub downloads, according to the available data) and Abstracts Views on Vision4Press platform.
Data correspond to usage on the plateform after 2015. The current usage metrics is available 48-96 hours after online publication and is updated daily on week days.
Initial download of the metrics may take a while.