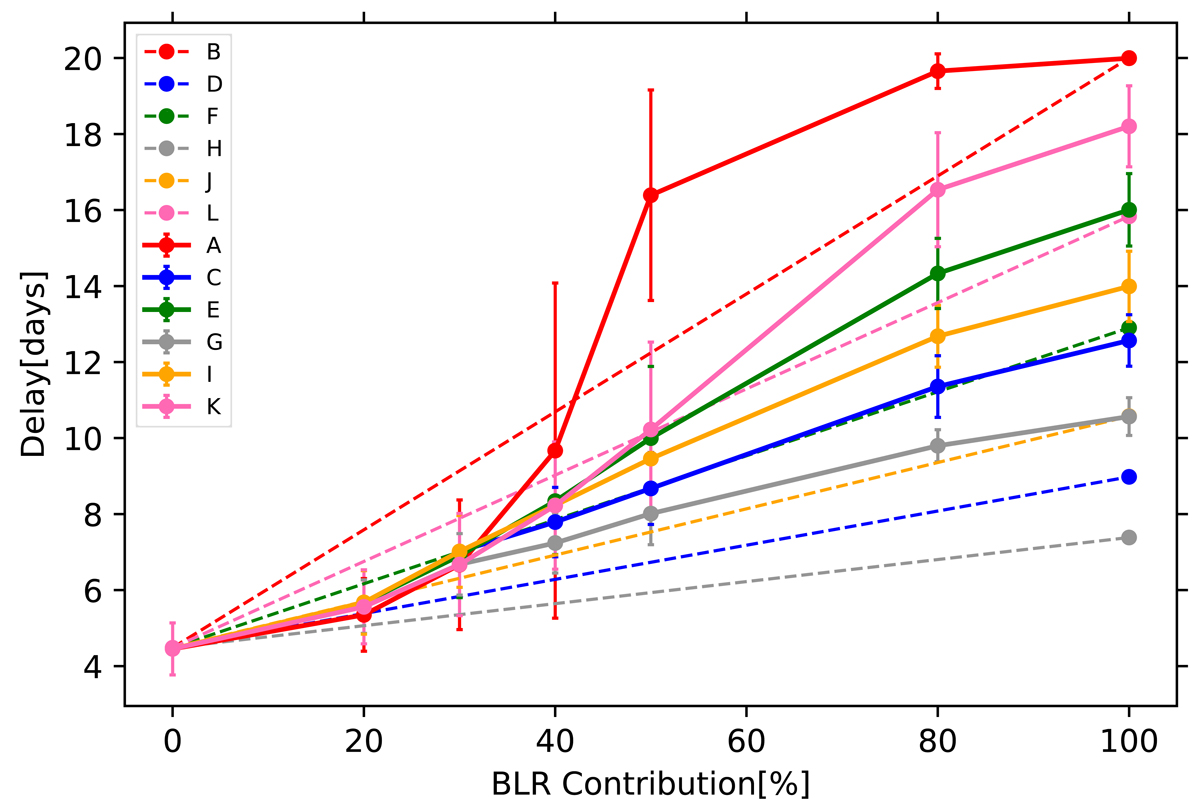
Fig. 15.
Download original image
Time delay as a function of BLR contribution for different BLR response functions. Dashed lines show the linear interpolation between the extreme cases of no BLR contribution to time delay and 100% of disk photons reprocessed by the BLR. Points show the intermediate delays calculated from stochastic light curves using ICCF between X-ray light curve and 7961.59 Å for different shapes of the BLR transfer function: A = Gaussian (τpeak = 20, σ = 5); C = half-Gaussian (τpeak = 5, σ = 5); E = half-Gaussian2 (τpeak = 5, σ = 10); G = half-Gaussian3 (τpeak = 5, σ = 3); K = half-Gaussian4 (τpeak = 5, σ = 7); and I = half-Gaussian5 (τpeak = 5, σ = 15). All values of τpeak and σ given in days. Solid lines show the ICCF delay measured between X-ray light curve and 7961.59 Å light curve by varying the BLR contribution using different BLR response function (B = Gaussian, D = half-Gaussian, F = half-Gaussian2, H = half-Gaussian3, J = half-Gaussian4, and L = half-Gaussian5). All data points are summarized in Table 1.
Current usage metrics show cumulative count of Article Views (full-text article views including HTML views, PDF and ePub downloads, according to the available data) and Abstracts Views on Vision4Press platform.
Data correspond to usage on the plateform after 2015. The current usage metrics is available 48-96 hours after online publication and is updated daily on week days.
Initial download of the metrics may take a while.