Fig. 5.
Download original image
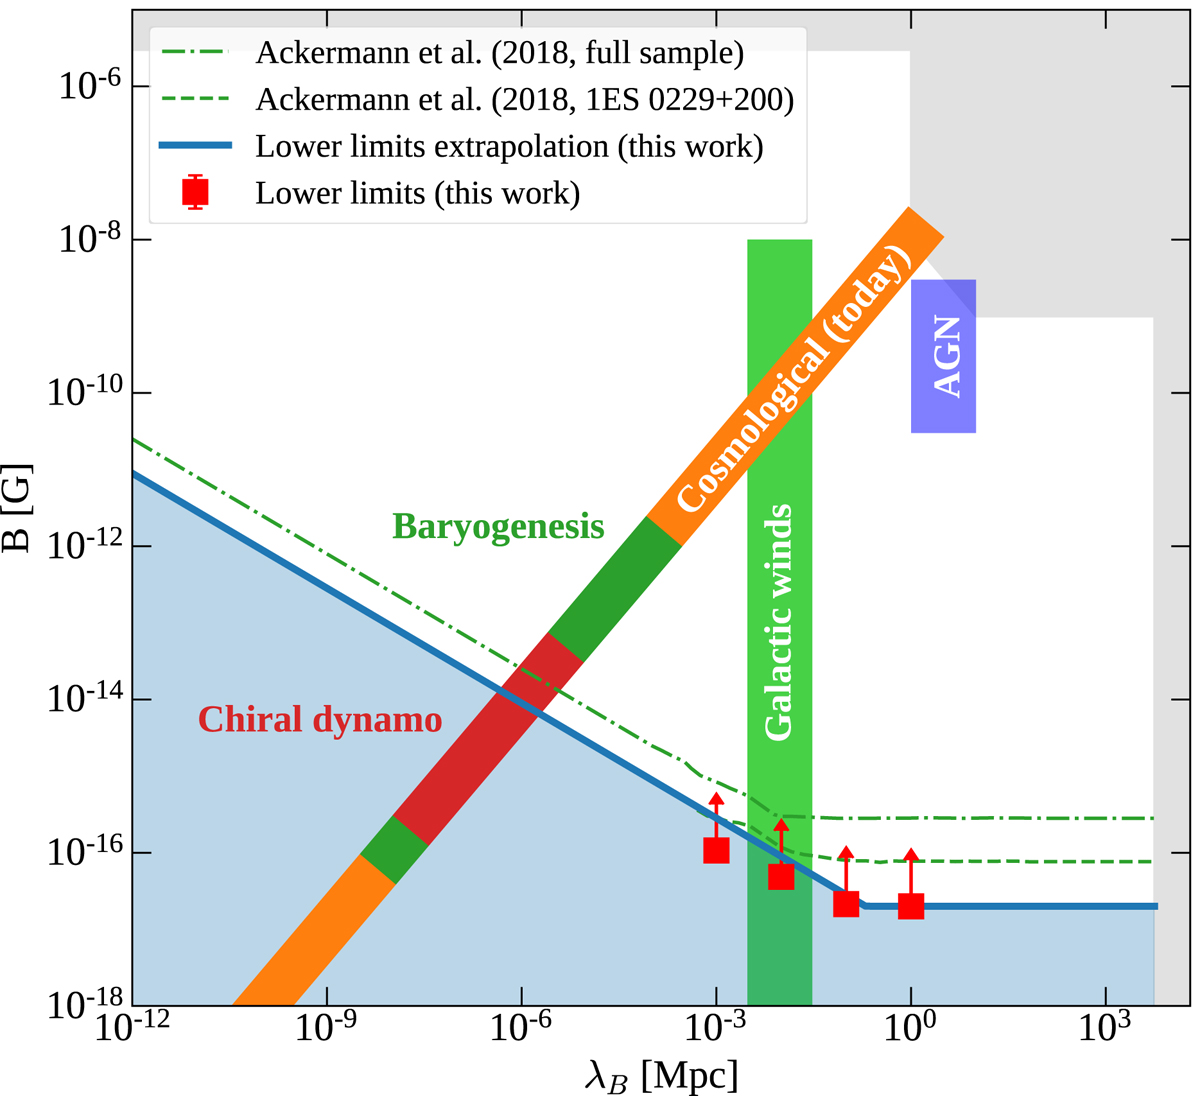
Lower bound on IGMF strength derived from Fermi/LAT and Cherenkov telescope datasets (thick blue curve and red data points, respectively). The green dot-dashed and dashed curves show previous Fermi/LAT limits derived for the full source sample and 1ES 0229+200 only, respectively (Ackermann et al. 2018). The light-grey shaded upper bound shows previously known limits on the IGMF strength and correlation length from radio telescope data (Kronberg 1994) and CMB (Planck Collaboration XIII 2016) analysis, as well as from theoretical estimates (Durrer & Neronov 2013). The inclined orange stripe shows the locus of end points of evolution of cosmological magnetic fields (Banerjee & Jedamzik 2004). The red stripe marks the possible range of the magnetic field produced by the chiral dynamo (Joyce & Shaposhnikov 1997; Neronov & Semikoz 2020). The dark green stripe denotes the range of electroweak phase transition magnetic fields that might explain the observed baryonic asymmetry of the Universe (Giovannini & Shaposhnikov 1998; Fujita & Kamada 2016; Kamada & Long 2016). The filled vertical green and violet boxes show favoured regions of IGMF generated by a frozen-in magnetic field, originating from AGN outflows (Furlanetto & Loeb 2001) or galactic winds (Bertone et al. 2006) as labelled in the figure.
Current usage metrics show cumulative count of Article Views (full-text article views including HTML views, PDF and ePub downloads, according to the available data) and Abstracts Views on Vision4Press platform.
Data correspond to usage on the plateform after 2015. The current usage metrics is available 48-96 hours after online publication and is updated daily on week days.
Initial download of the metrics may take a while.