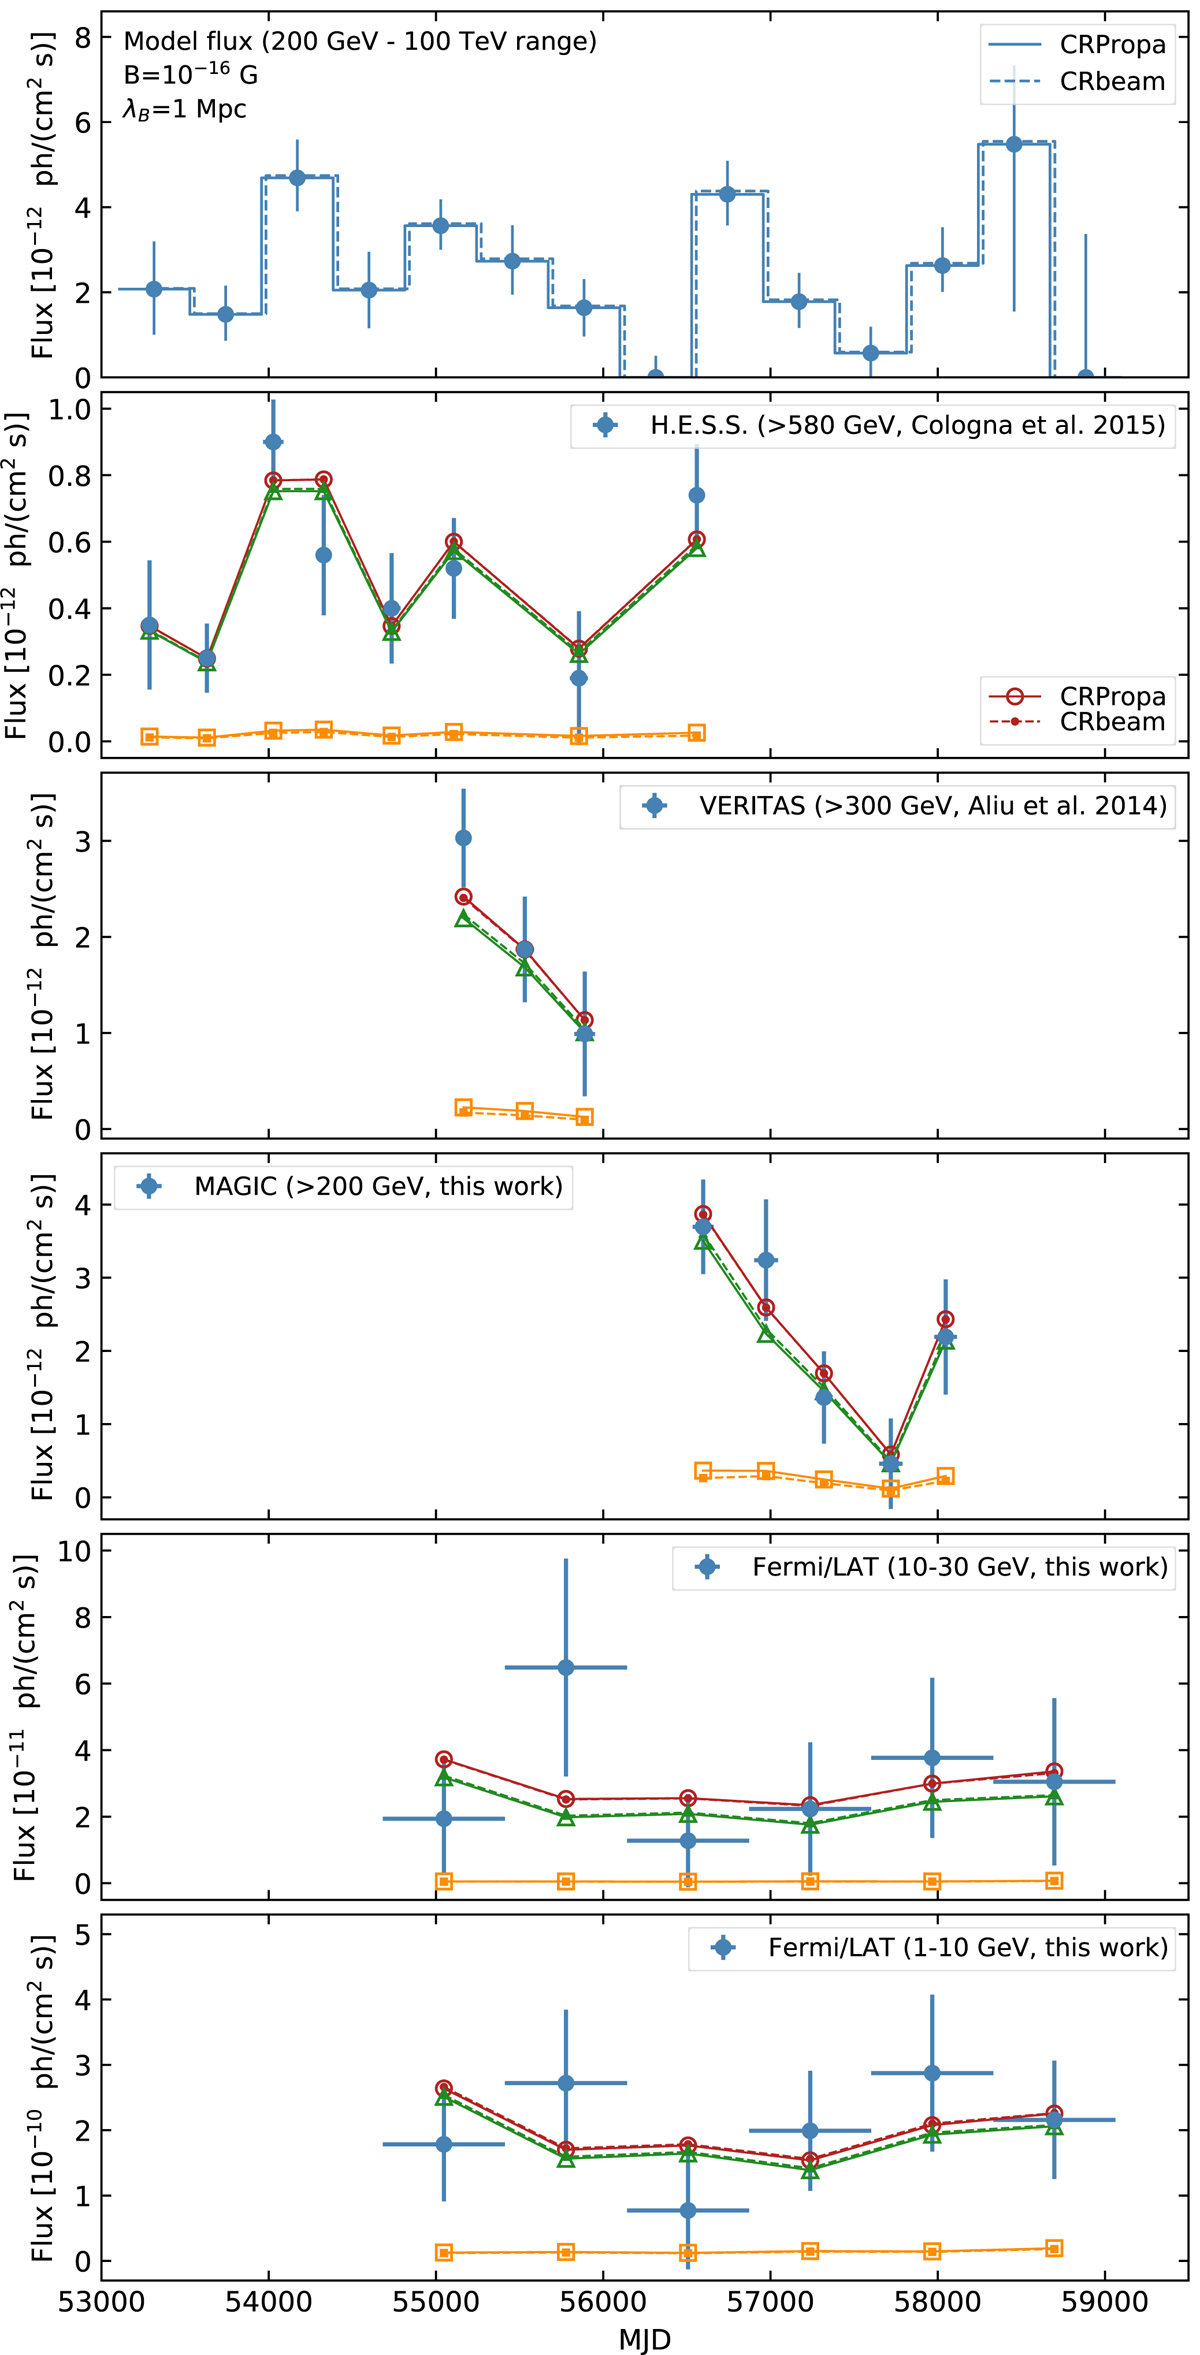
Fig. 2.
Download original image
Light curve of 1ES 0229+200 in several energy bands along with an exemplary fit with an IGMF with strength B = 10−16 G and a coherence scale of λB = 1 Mpc. The top panel represents the best-fit model light curve (along with its uncertainties) used to make the predictions in the energy bands where the measurements were taken (the panels below). The Fermi/LAT and MAGIC data are reported in the text; H.E.S.S. and VERITAS measurements were taken from Cologna et al. (2015) and Aliu et al. (2014) correspondingly. The primary, cascade, and total source fluxes are denoted with green triangles, orange squares, and red circles, correspondingly. Solid and dashed lines represent calculations with CRPropa (Alves Batista et al. 2016) and CRbeam (Berezinsky & Kalashev 2016) Monte Carlo codes respectively; the latter use the small point-like markers to distiguish themselves.
Current usage metrics show cumulative count of Article Views (full-text article views including HTML views, PDF and ePub downloads, according to the available data) and Abstracts Views on Vision4Press platform.
Data correspond to usage on the plateform after 2015. The current usage metrics is available 48-96 hours after online publication and is updated daily on week days.
Initial download of the metrics may take a while.