Fig. 6
Download original image
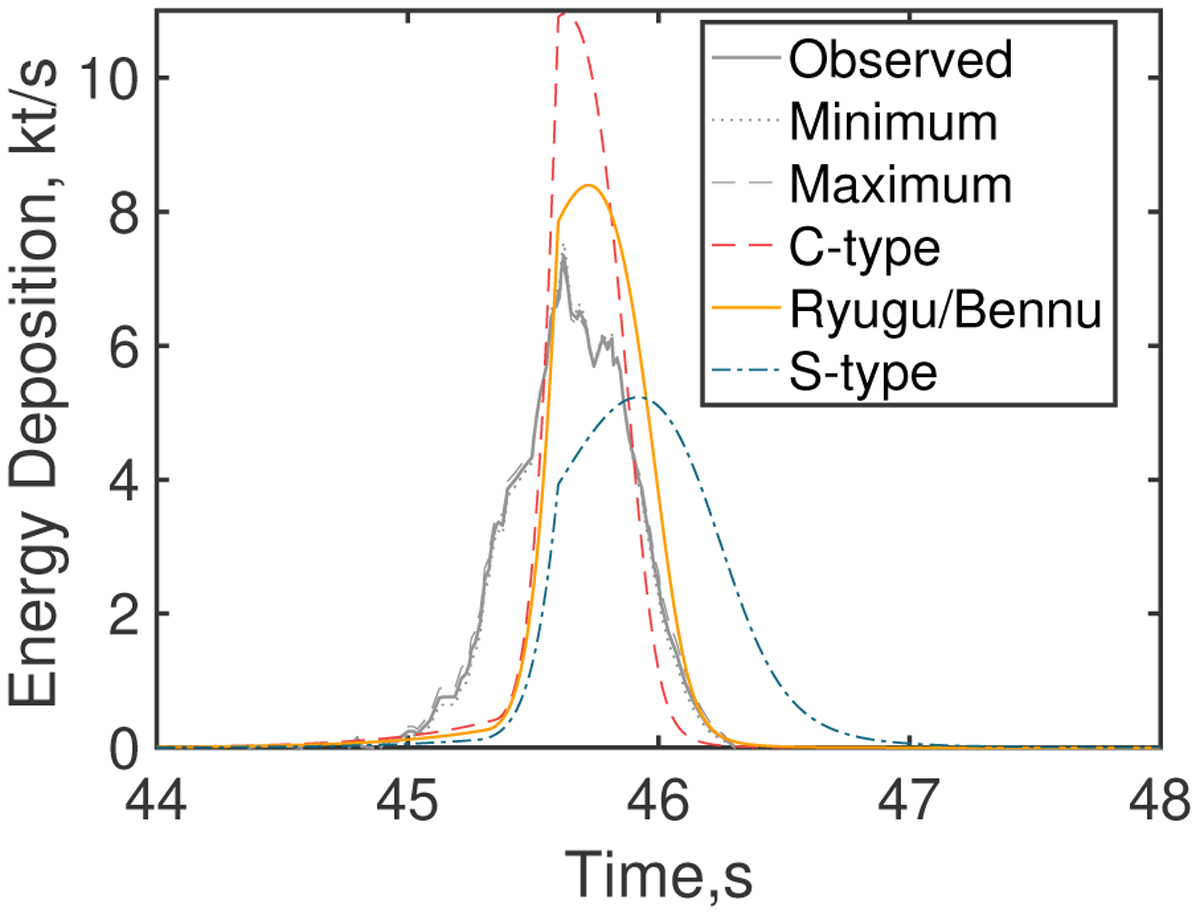
Energy deposition curves of 2022 EB5. The energy deposition per second as a function of time instead of the energy loss per km varying as the altitude is shown in order to facilitate comparison. The time axis represents the second that passed 21:22 on March 11, 2022 UTC time. The maximum energy deposition rate occurs at 45.6 s, when the peak brightness as well as the so-called air burst takes place. The gray line represents the curve derived from the light curve reported by CNEOS, whereas the red dashed line, the yellow line, and the blue dot-dashed line illustrate the energy deposition curve of the C-type, Ryugu/Bennu, and S-type groups.
Current usage metrics show cumulative count of Article Views (full-text article views including HTML views, PDF and ePub downloads, according to the available data) and Abstracts Views on Vision4Press platform.
Data correspond to usage on the plateform after 2015. The current usage metrics is available 48-96 hours after online publication and is updated daily on week days.
Initial download of the metrics may take a while.