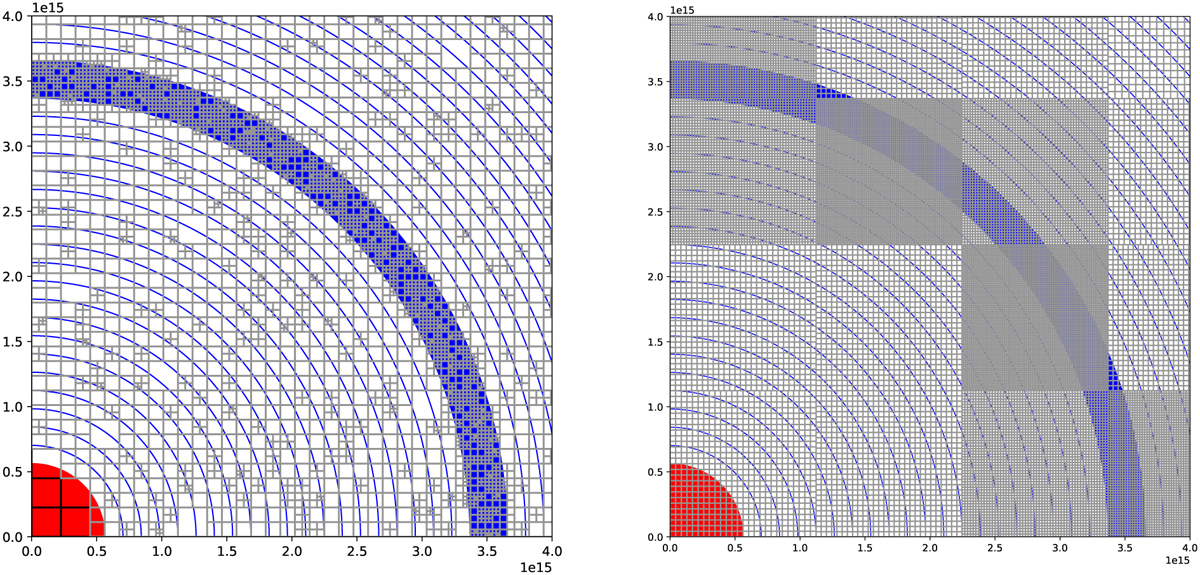
Fig. 8
Download original image
Adaptive propagation grids calculated for the double-clump spherically symmetrical model. We have plotted only one quadrant in the zero plane. The red “circle” is the central star, blue circles represent the model grid shells and the grey and the blue Cartesian grid represent propagation grid. It is clear that in the area of the clump the density of the propGrid is much larger. Left: Octgrid, basic grid: 503, 106 virtual points, right: one-level subgrid, basic grid: 103, 106 virtual points.
Current usage metrics show cumulative count of Article Views (full-text article views including HTML views, PDF and ePub downloads, according to the available data) and Abstracts Views on Vision4Press platform.
Data correspond to usage on the plateform after 2015. The current usage metrics is available 48-96 hours after online publication and is updated daily on week days.
Initial download of the metrics may take a while.