Fig. 6
Download original image
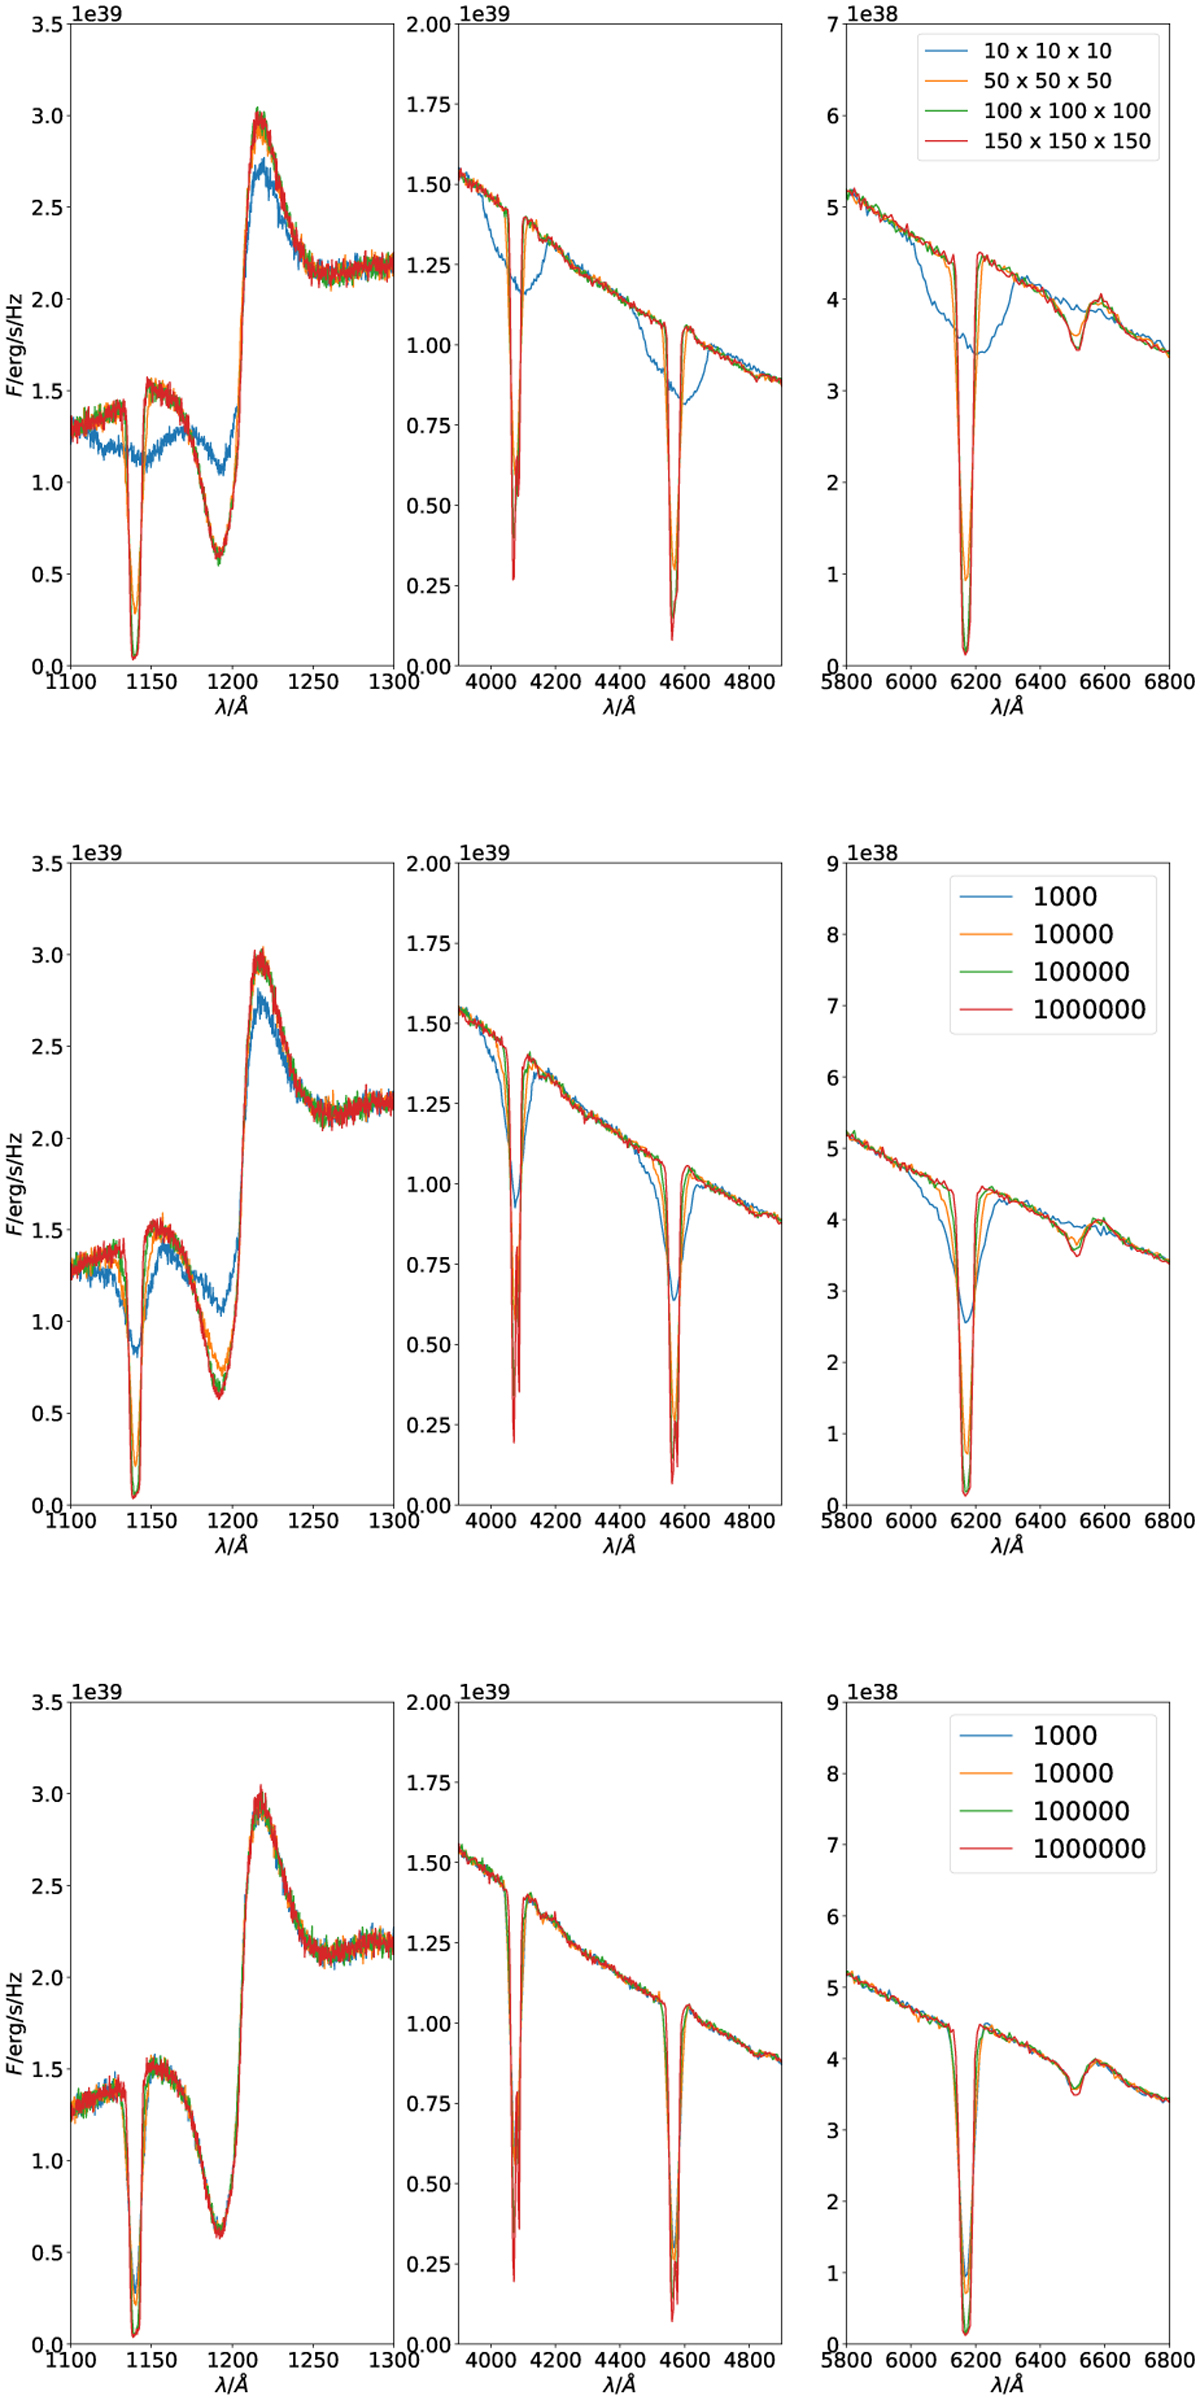
Comparison of spectra calculated with different propGrids in the case of the double clump density profile. Upper panels: with different number of cells in the basic propGrid. Middle panels: the octgrid: with different number of the virtual points, basic grid size is 10 × 10 × 10. Lower panels: the octgrid: with different number of virtual points, basic grid size is 50 × 50 × 50.
Current usage metrics show cumulative count of Article Views (full-text article views including HTML views, PDF and ePub downloads, according to the available data) and Abstracts Views on Vision4Press platform.
Data correspond to usage on the plateform after 2015. The current usage metrics is available 48-96 hours after online publication and is updated daily on week days.
Initial download of the metrics may take a while.