Fig. 5
Download original image
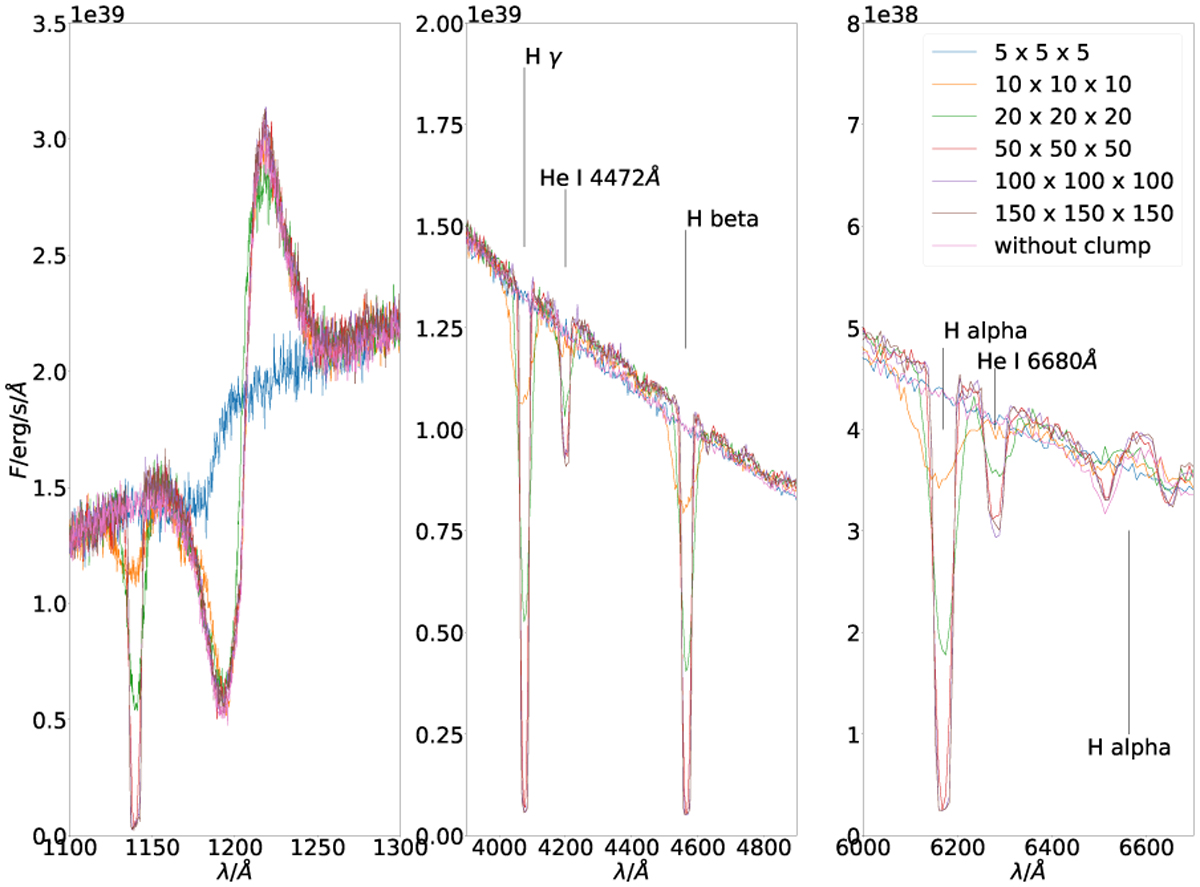
Comparison of spectral line profiles calculated with different basic propGrids in the case of the single clump model. Left panel: hydrogen Lya line with a P-Cyg profile and the clump absorption component. Central and right panel: Hydrogen Balmer lines and neutral helium absorption lines. Line labels correspond to their vacuum wavelengths.
Current usage metrics show cumulative count of Article Views (full-text article views including HTML views, PDF and ePub downloads, according to the available data) and Abstracts Views on Vision4Press platform.
Data correspond to usage on the plateform after 2015. The current usage metrics is available 48-96 hours after online publication and is updated daily on week days.
Initial download of the metrics may take a while.