Fig. 4
Download original image
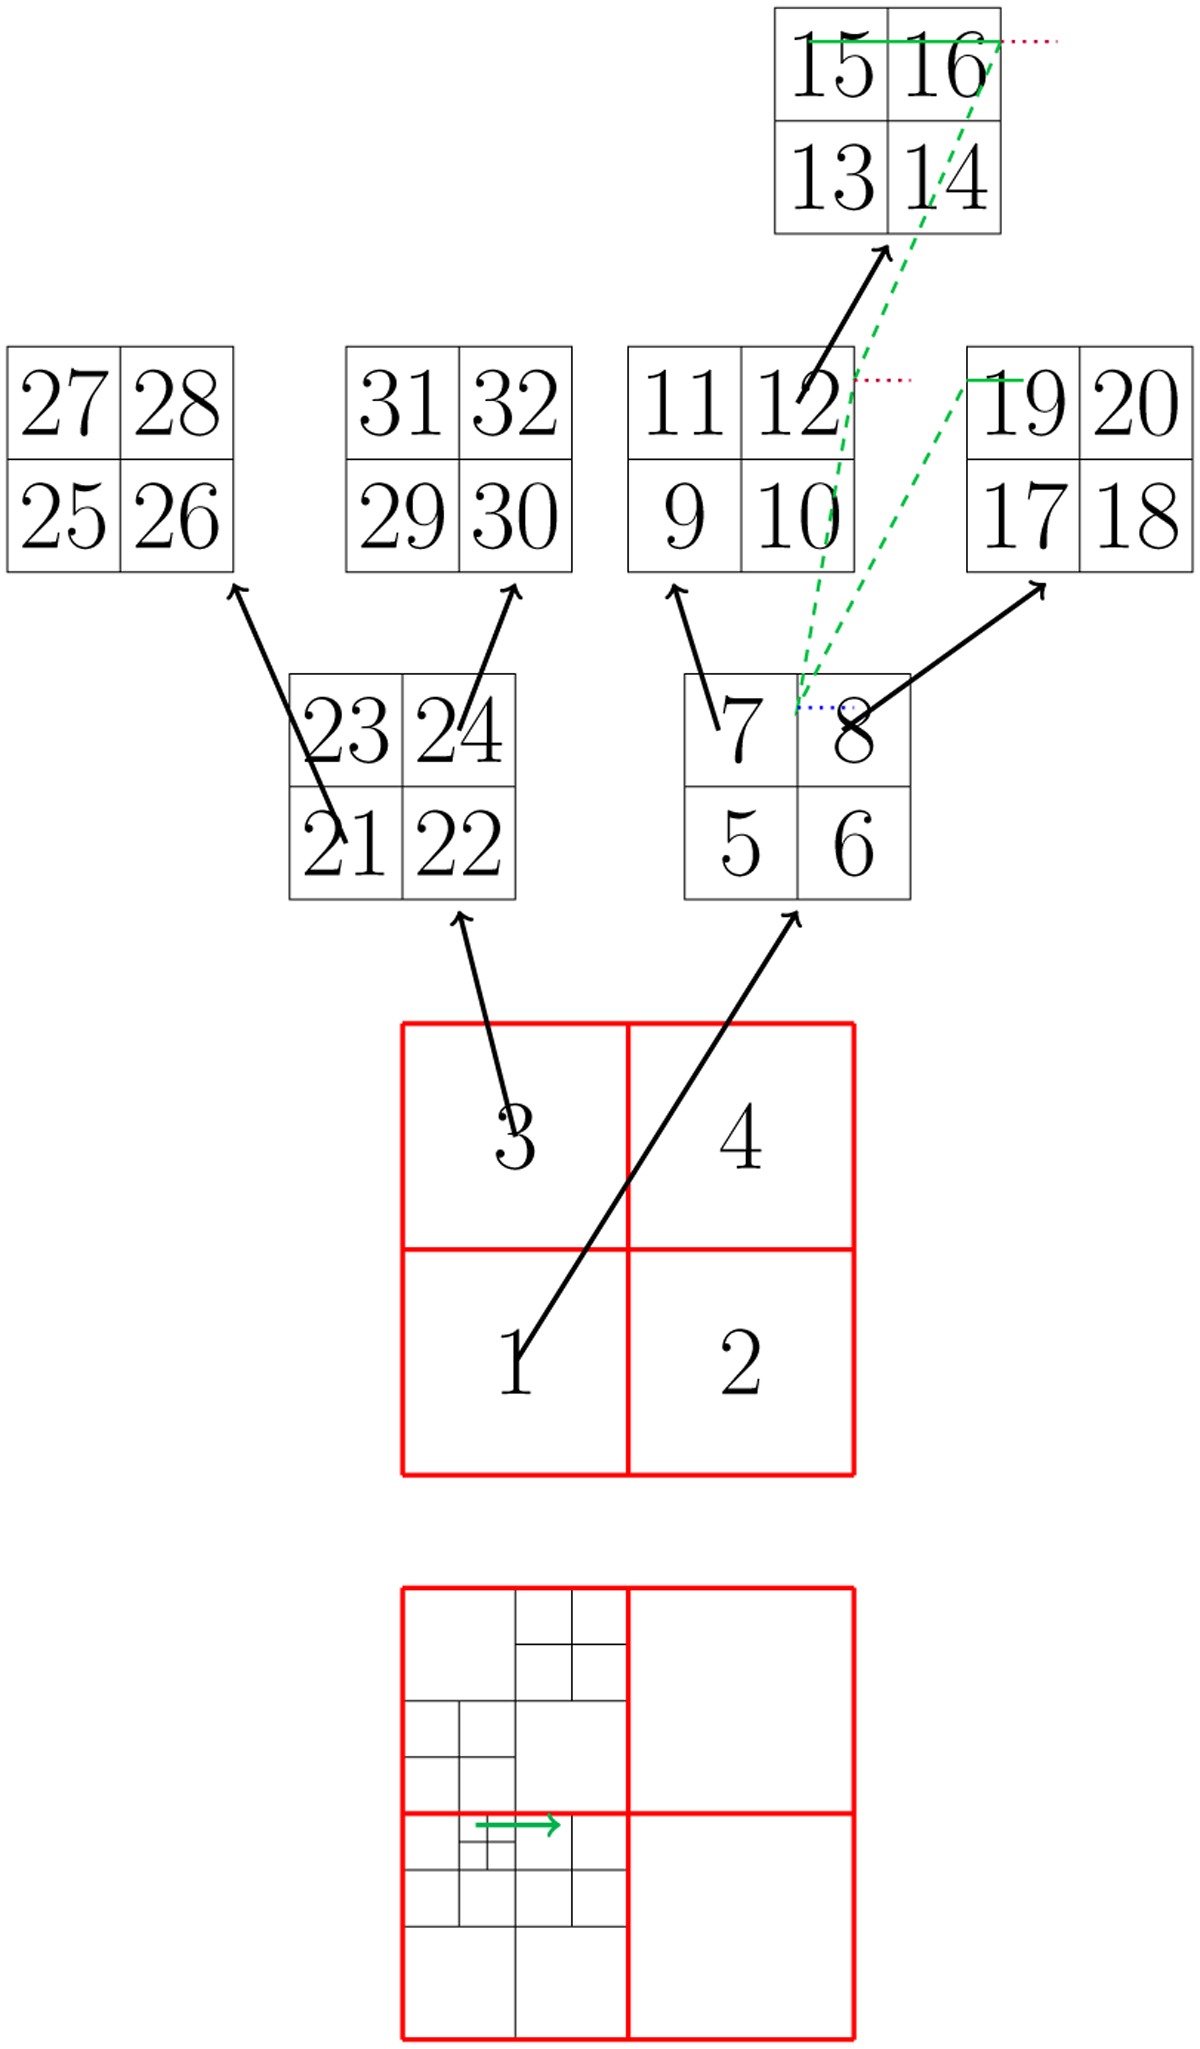
Scheme of the packet propagation through the grid. The bottom scheme shows a propagation grid. The upper scheme shows the same grid, but expressed in a tree structure. The green line is an example of packet’s path. It is simple to show this path on the lower graph. The upper graph explicitly shows the adaptive propagation grid level structure including the illustration of cell indexing. The numbers in the figure describe the logic of cell indexing in the code.
Current usage metrics show cumulative count of Article Views (full-text article views including HTML views, PDF and ePub downloads, according to the available data) and Abstracts Views on Vision4Press platform.
Data correspond to usage on the plateform after 2015. The current usage metrics is available 48-96 hours after online publication and is updated daily on week days.
Initial download of the metrics may take a while.