Fig. A.1
Download original image
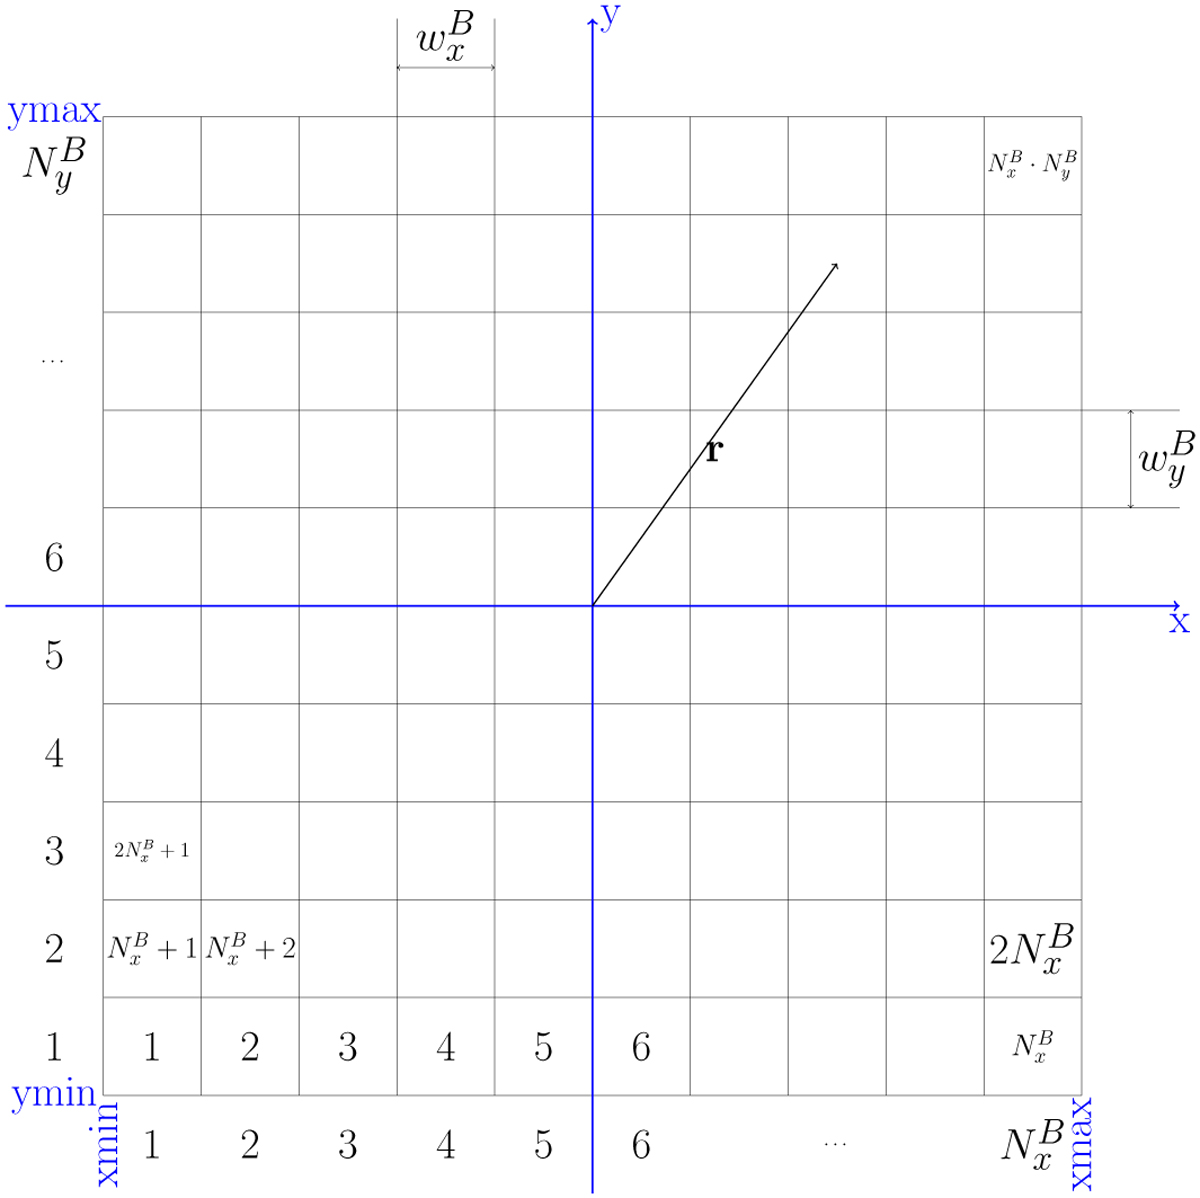
Scheme of the basic propGrid and its coordinates. For simplicity, only two dimensions, coordinates x and y, are plotted here. Each cell has widths ![]() and
and ![]() . Numbers below the figure and on the left denote
. Numbers below the figure and on the left denote ![]() and
and ![]() for particular cells, respectively. The cell indexes following from Eq. (A.1) are written in the centers of selected cells. Generalization to three dimensions is straightforward.
for particular cells, respectively. The cell indexes following from Eq. (A.1) are written in the centers of selected cells. Generalization to three dimensions is straightforward.
Current usage metrics show cumulative count of Article Views (full-text article views including HTML views, PDF and ePub downloads, according to the available data) and Abstracts Views on Vision4Press platform.
Data correspond to usage on the plateform after 2015. The current usage metrics is available 48-96 hours after online publication and is updated daily on week days.
Initial download of the metrics may take a while.