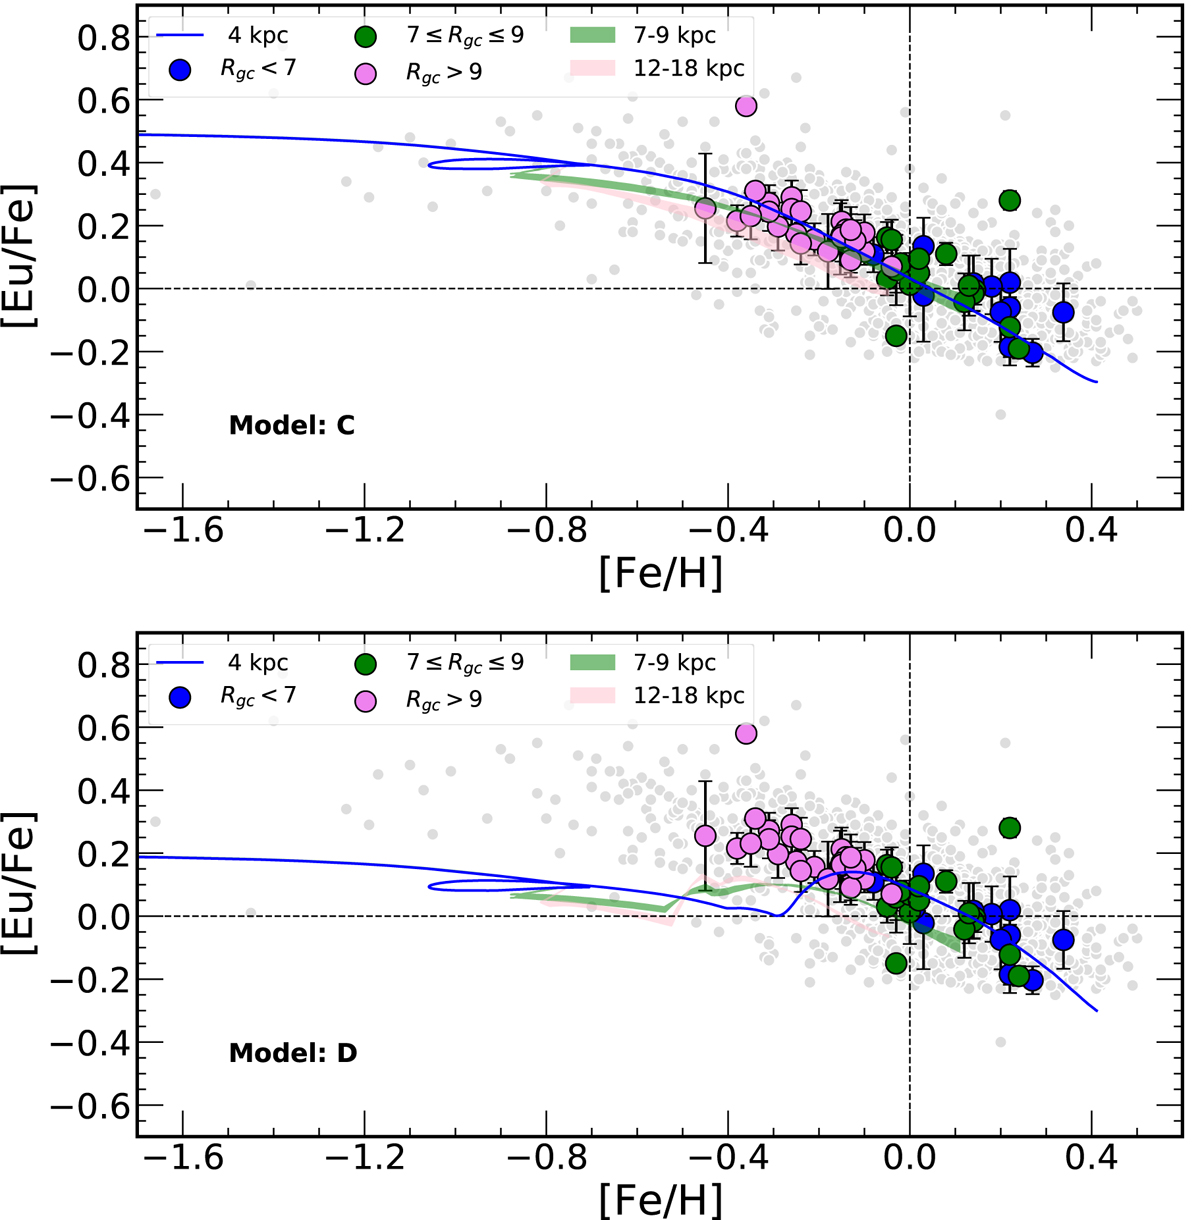
Fig. 4.
Download original image
[Eu/Fe] vs. [Fe/H] for the field-star sample and the OC sample. The data are colour-coded by Galactocentric bin, and compared with three curves of a given model, corresponding to the same radial regions and coloured in the same way as the data: inner disc (blue), solar-ring (green), and outer disc (pink). We report only models C and D, since the prescriptions for Eu in models A and B are the same as in model C. Small grey dots stand for the field-star sample. Top: comparison with model C. Bottom: comparison with model D. The error bars for the y-axis are displayed for the OC sample.
Current usage metrics show cumulative count of Article Views (full-text article views including HTML views, PDF and ePub downloads, according to the available data) and Abstracts Views on Vision4Press platform.
Data correspond to usage on the plateform after 2015. The current usage metrics is available 48-96 hours after online publication and is updated daily on week days.
Initial download of the metrics may take a while.