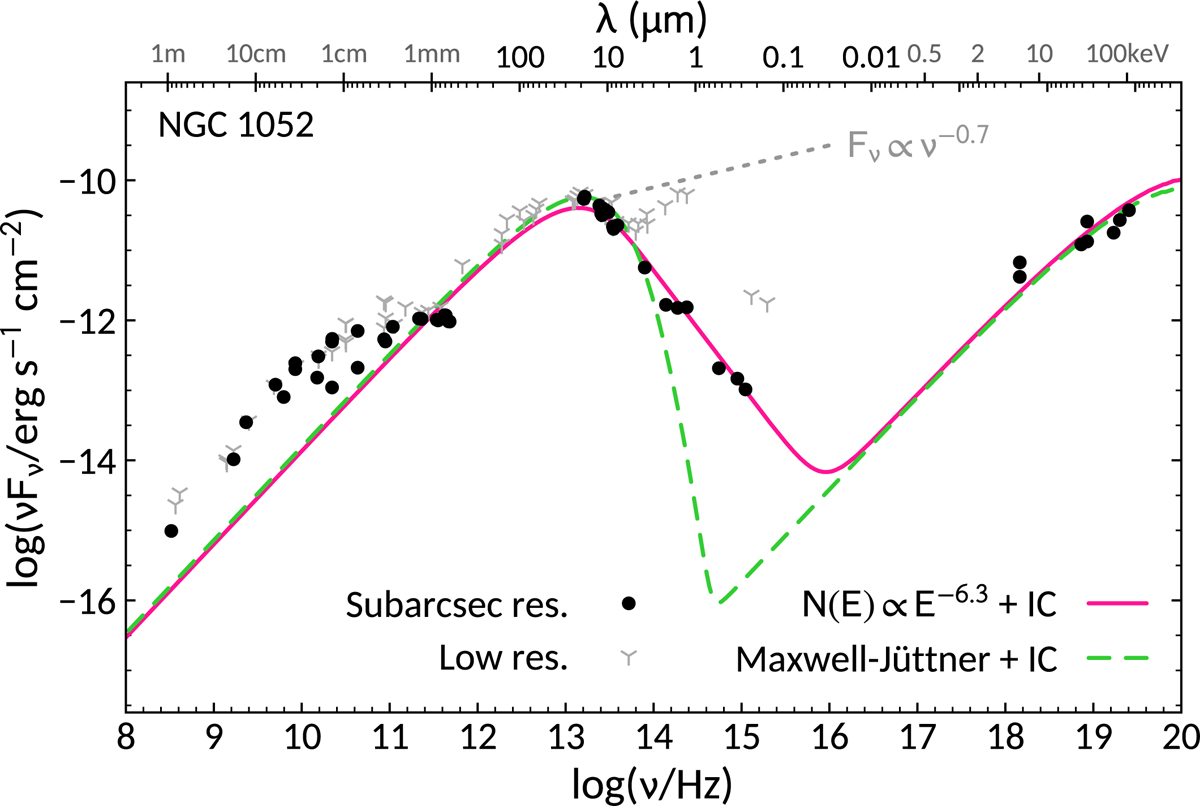
Fig. 8.
Download original image
Observed SED for NGC 1052 at subarsec (black circles) and low-angular resolution (grey spikes) compared with the predicted self-absorbed synchrotron plus associated inverse Compton (IC) emission for two particle distributions: a Maxwell-Jüttner energy distribution (dashed green line), representative of a thermalised distribution of relativistic electrons; and a power law energy distribution with a steep index, p = 6.3 (solid pink line; see Eq. (2)). For comparison, the continuum spectrum expected for a power-law energy distribution with p = 2.4 (Fν ∝ ν−0.7) is also shown (dotted grey line).
Current usage metrics show cumulative count of Article Views (full-text article views including HTML views, PDF and ePub downloads, according to the available data) and Abstracts Views on Vision4Press platform.
Data correspond to usage on the plateform after 2015. The current usage metrics is available 48-96 hours after online publication and is updated daily on week days.
Initial download of the metrics may take a while.