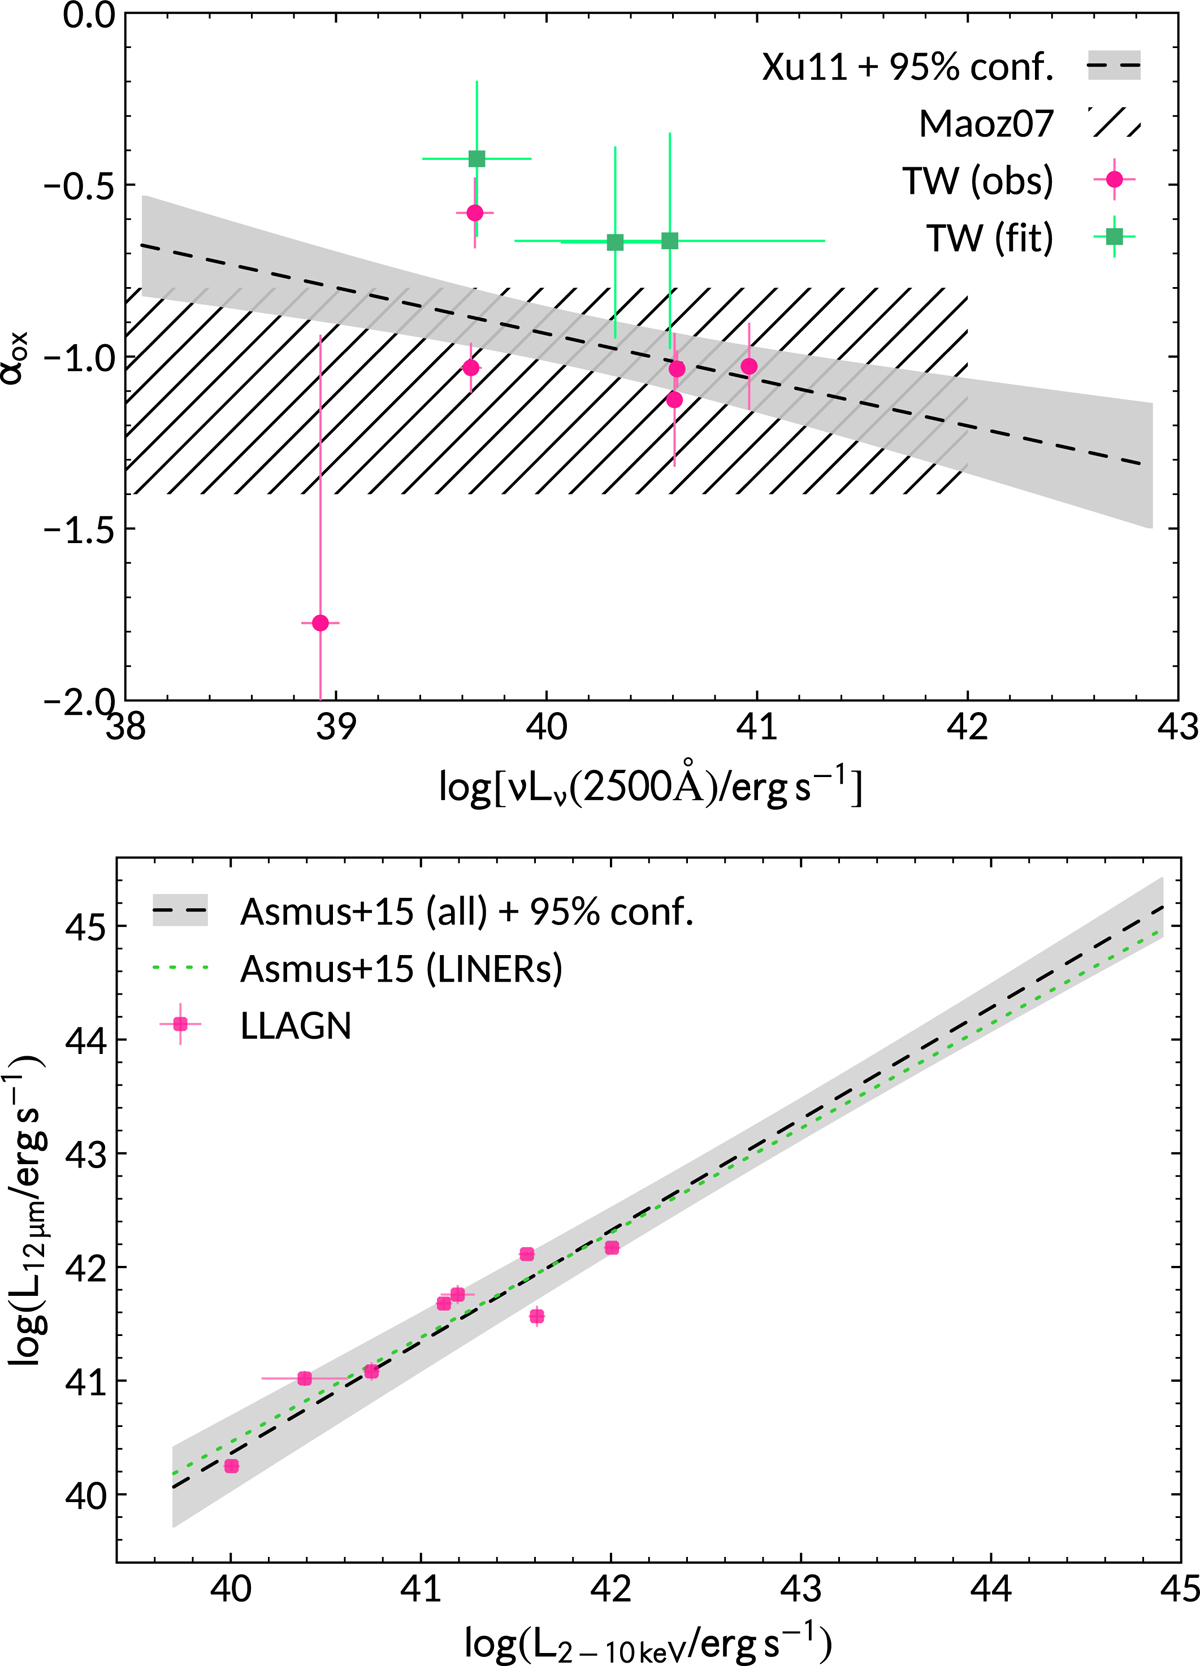
Fig. 7.
Download original image
Optical-to-UV spectral slope in the 2500 Å–2 keV range (αox) versus the luminosity log(νLν) at 2500 Å for the LLAGN in our sample (top panel) using direct measurements (pink circles) and values inferred from the power-law fit (green squares). The majority of the sources are in agreement with the distribution of these parameters in the sample of Maoz (2007), shown by the hatched area, and the correlation derived by Xu (2011) for the Palomar sample (dashed-black line and shaded-grey area). The comparison between the 12 μm mid-IR and the 2–10 keV X-ray luminosities (bottom panel) for the LLAGN in our sample (pink circles) fall within the 95% confidence interval (shaded-grey area) of the correlation derived by Asmus et al. (2015) for a sample of 152 nearby AGN (dashed-black line), including 19 LINER nuclei (dotted-green line for the correlation derived for the LINER sub-sample).
Current usage metrics show cumulative count of Article Views (full-text article views including HTML views, PDF and ePub downloads, according to the available data) and Abstracts Views on Vision4Press platform.
Data correspond to usage on the plateform after 2015. The current usage metrics is available 48-96 hours after online publication and is updated daily on week days.
Initial download of the metrics may take a while.