Fig. 6.
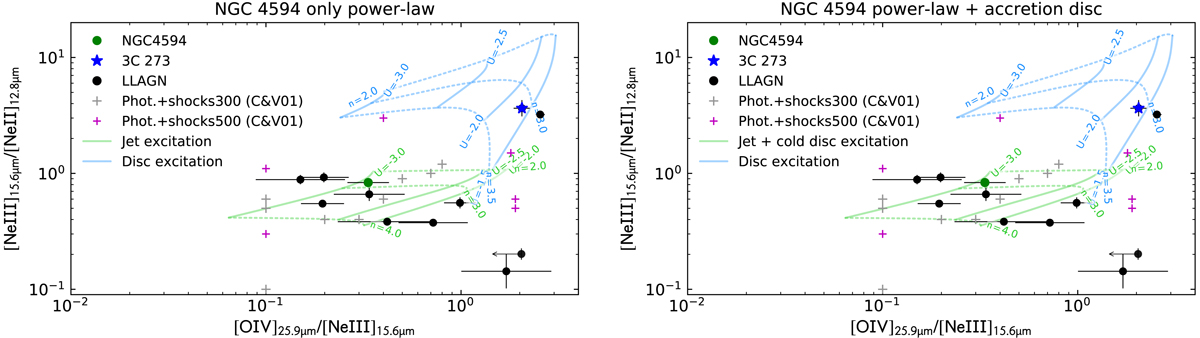
Download original image
Diagnostic diagrams for the LLAGN sample with photo-ionisation models of the Sombrero galaxy overlaid. Black dots show the observed flux ratios with their associated uncertainty. The green grid is constructed by interpolation of the values of certain line ratios which correspond to different values of ionisation parameter U and hydrogen density n0. These ratios are calculated with CLOUDY simulations. In the left panel, the input radiation field for these models is the power law fit to NGC 4594 shown in Fig. 5, while in the right panel the accretion disc (also shown in Fig. 5) is included. The blue grid represents the model predictions using the 3C 273 power-law fit (Fig. 5) as input radiation source. Predictions for models including both photo-ionisation and shocks, from Contini & Viegas (2001), are shown by the crosses in grey (shock velocity of v = 300 km s−1 and pre-shock density of n0 = 300 cm−3), and purple (v = 500 km s−1) colour. The various models correspond to different cloud sizes and radiation field intensities (see Sect. 4.2).
Current usage metrics show cumulative count of Article Views (full-text article views including HTML views, PDF and ePub downloads, according to the available data) and Abstracts Views on Vision4Press platform.
Data correspond to usage on the plateform after 2015. The current usage metrics is available 48-96 hours after online publication and is updated daily on week days.
Initial download of the metrics may take a while.