Fig. 3.
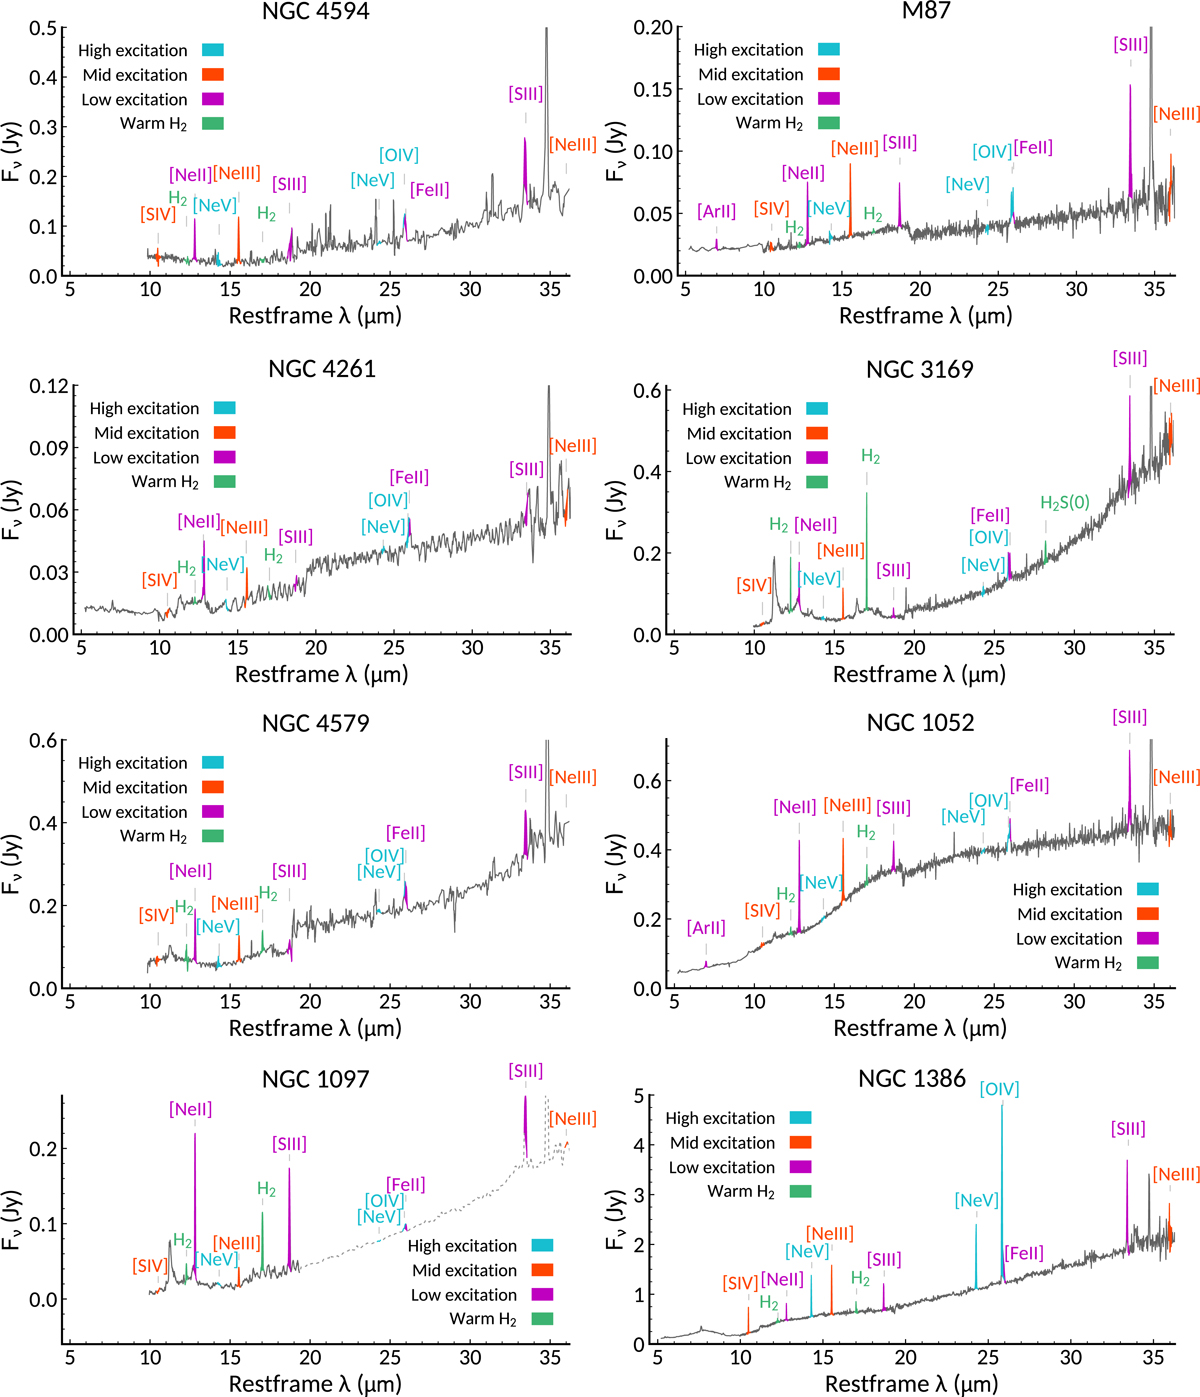
Download original image
Spitzer/IRS mid-IR spectra for the sample of LLAGN obtained from the CASSIS database (Lebouteiller et al. 2011, 2015), including both the low- and the high-resolution modules. The main nebular and molecular gas lines are indicated, except for the [Si II]34.8 line which typically exceeds the flux range shown in the figure. The objects are sorted by increasing Eddington rate (λEdd; see Table 1). In the case of NGC 1097, the continuum in the long-high module (dotted line) has been scaled to match the short-high module at 19 μm, due to contamination from the star forming ring in this galaxy.
Current usage metrics show cumulative count of Article Views (full-text article views including HTML views, PDF and ePub downloads, according to the available data) and Abstracts Views on Vision4Press platform.
Data correspond to usage on the plateform after 2015. The current usage metrics is available 48-96 hours after online publication and is updated daily on week days.
Initial download of the metrics may take a while.