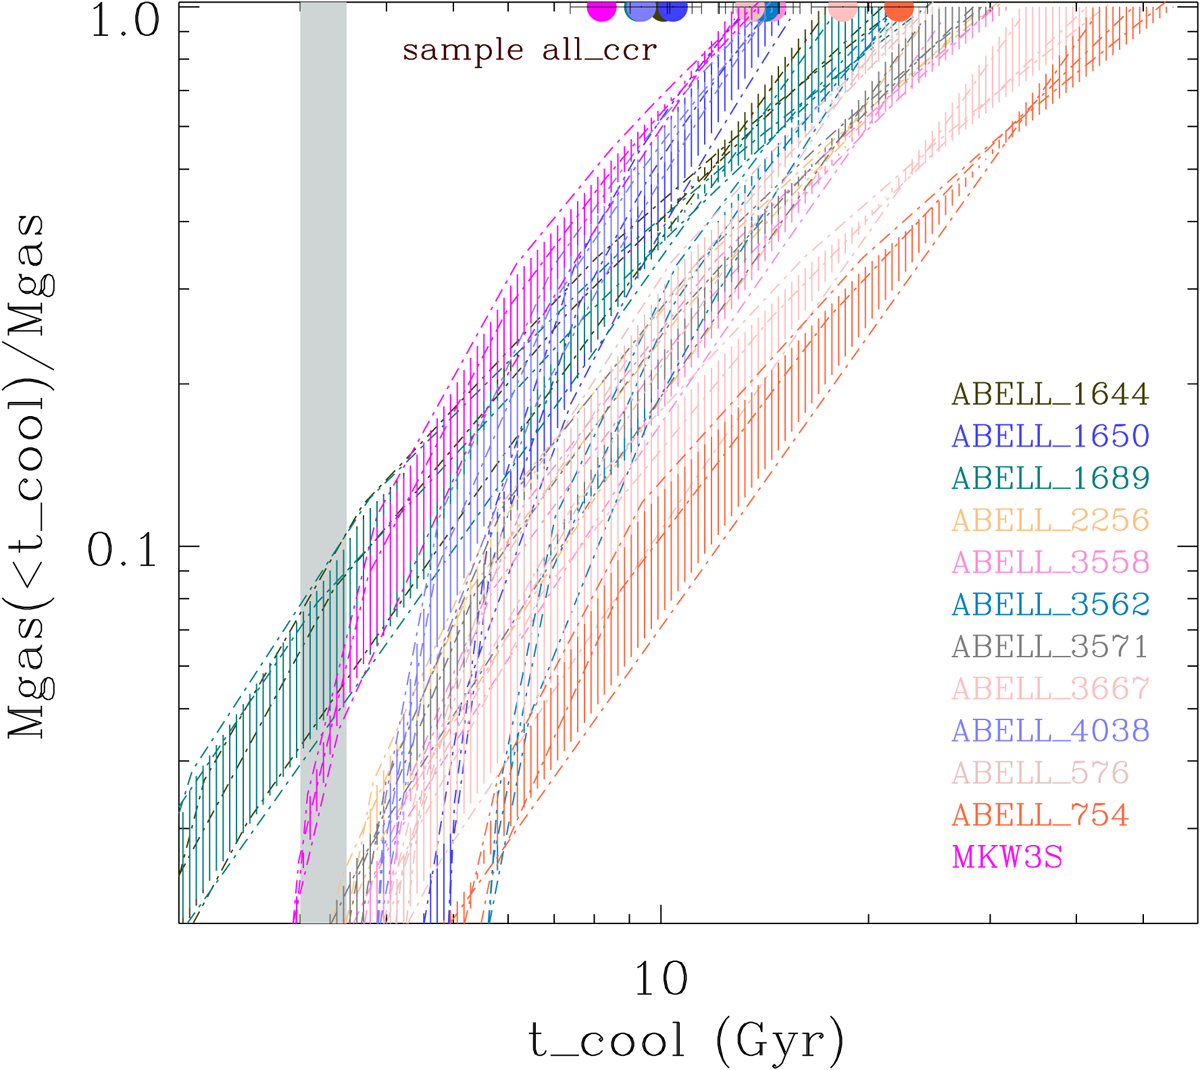
Fig. 7.
Download original image
Normalized cumulative gas mass versus cooling time for the objects in our sample. For each object we plot the distributions for p = −2, −100, 1 (α = 0.5, 0.99, 2) and shade the region between them. The gas mass is normalized to the total gas mass. For comparison we show, as small filled circles following the same color coding of the gas mass distributions, the values of the cooling time obtained from a single temperature analysis of our spectra. The gray vertical box corresponds to tcool = (3 − 3.3) Gyr. Note that only CC objects have mass distributions extending below this value.
Current usage metrics show cumulative count of Article Views (full-text article views including HTML views, PDF and ePub downloads, according to the available data) and Abstracts Views on Vision4Press platform.
Data correspond to usage on the plateform after 2015. The current usage metrics is available 48-96 hours after online publication and is updated daily on week days.
Initial download of the metrics may take a while.