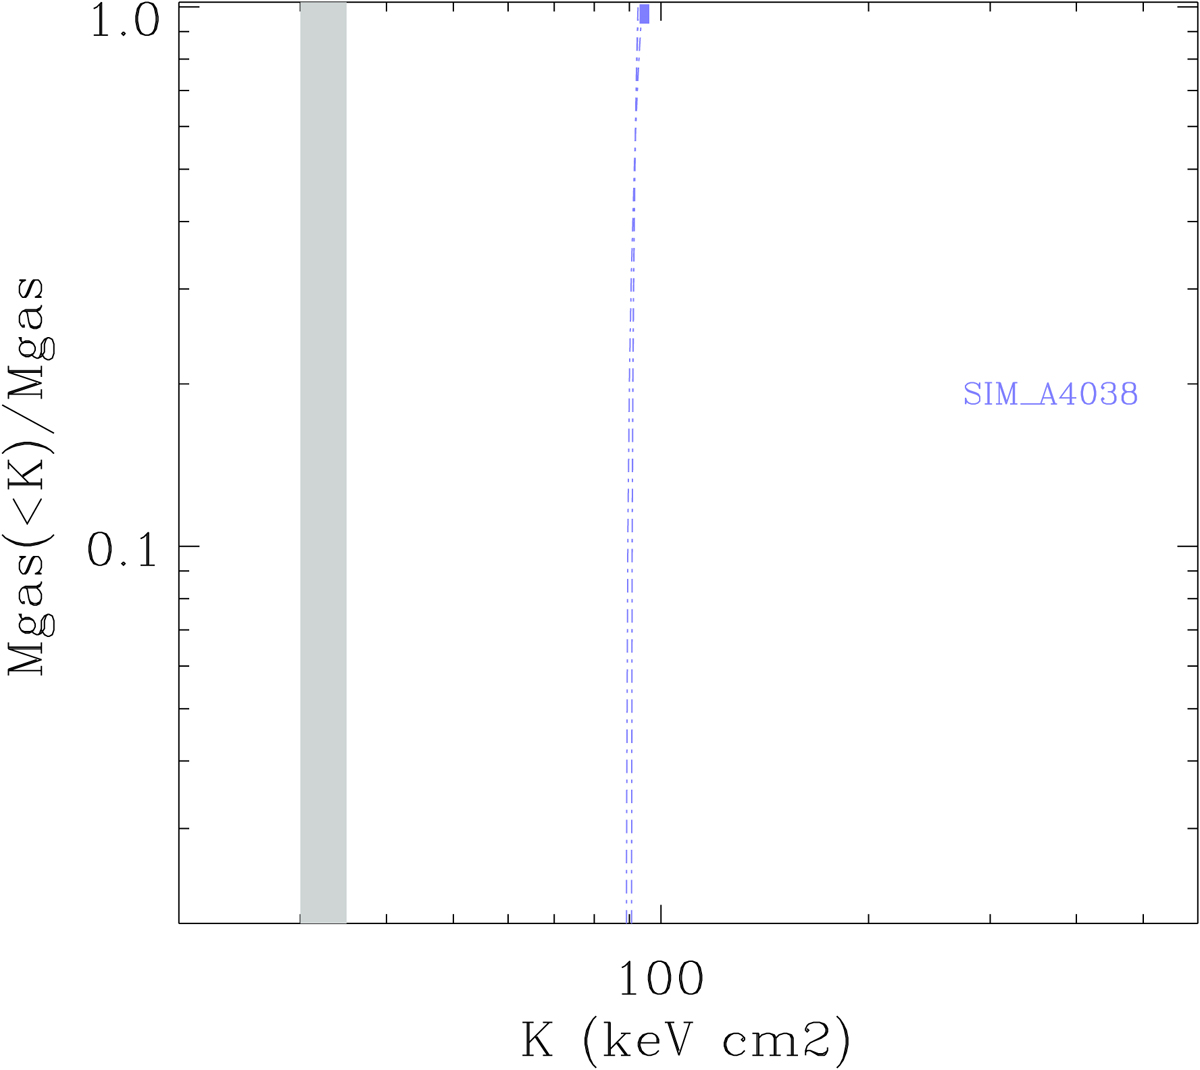
Fig. 5.
Download original image
Normalized cumulative gas mass versus entropy for a spectrum simulated from the one temperature best-fit to A4038. The gray vertical box corresponds to K = 30 − 33 keV cm2. Note that the gas mass versus entropy distribution is essentially vertical and the value of the entropy it identifies is in good agreement with the one determined from a single temperature analysis of the data.
Current usage metrics show cumulative count of Article Views (full-text article views including HTML views, PDF and ePub downloads, according to the available data) and Abstracts Views on Vision4Press platform.
Data correspond to usage on the plateform after 2015. The current usage metrics is available 48-96 hours after online publication and is updated daily on week days.
Initial download of the metrics may take a while.