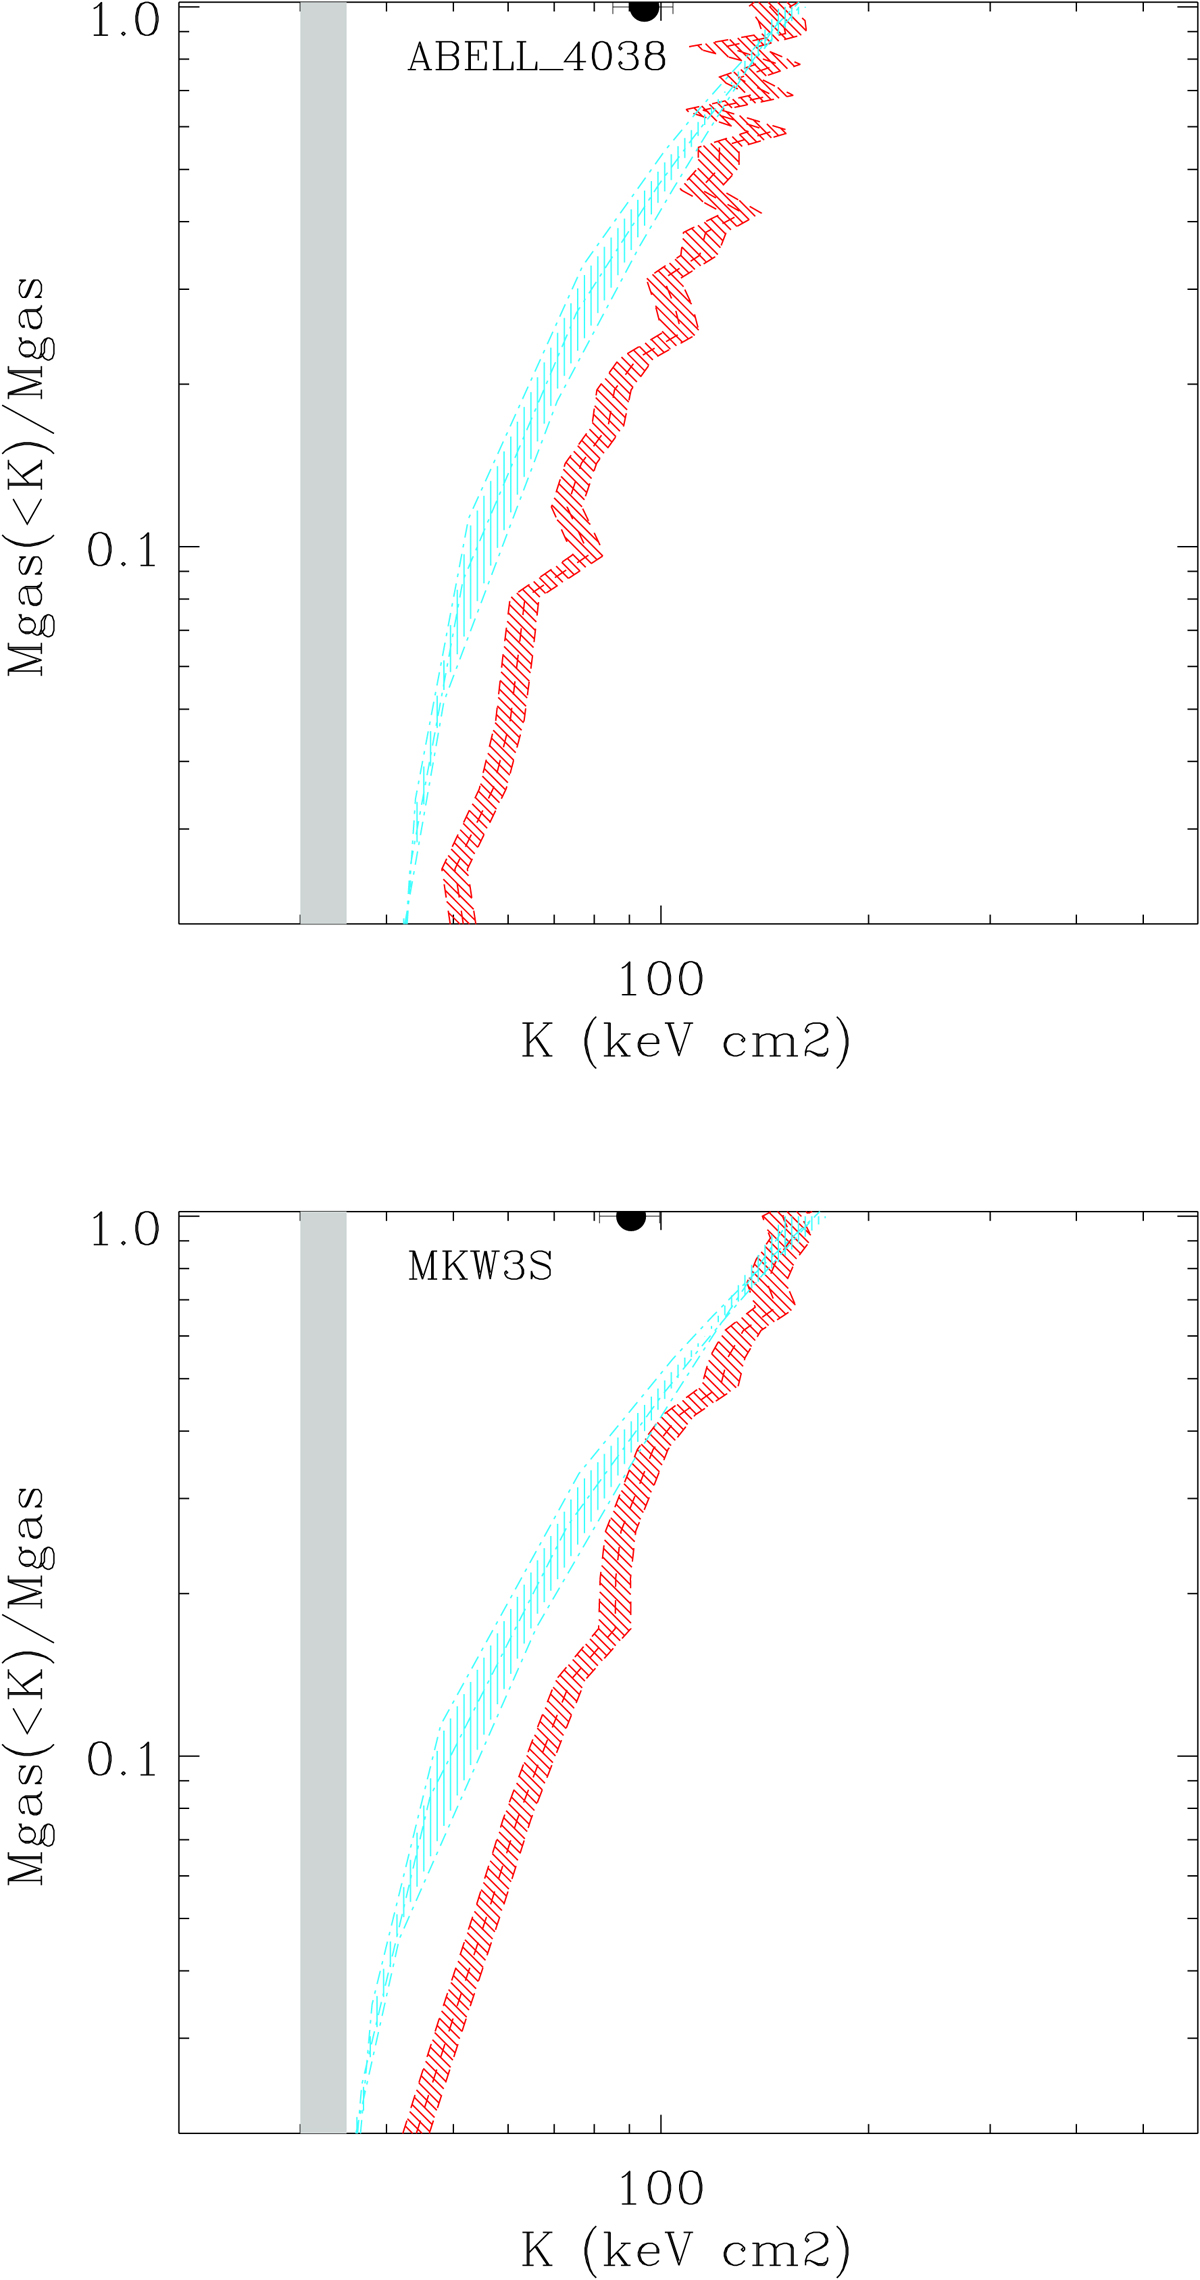
Fig. 3.
Download original image
Normalized cumulative gas mass versus entropy as derived with the isobaric model (light blue shaded region) and single temperature modeling of spatially resolved spectra from the ACCEPT archive of Chandra data (red shaded region). The distributions are normalized by dividing by the total gas mass. We show, as a filled circle the value of the entropy obtained from a single temperature analysis of our spectra. The gray vertical box corresponds to K = 30 − 33 keV cm2. Note that only CC objects are expected to have mass distributions extending below this entropy. Data for A4038 and MKW3s are shown respectively in the top and bottom panels.
Current usage metrics show cumulative count of Article Views (full-text article views including HTML views, PDF and ePub downloads, according to the available data) and Abstracts Views on Vision4Press platform.
Data correspond to usage on the plateform after 2015. The current usage metrics is available 48-96 hours after online publication and is updated daily on week days.
Initial download of the metrics may take a while.