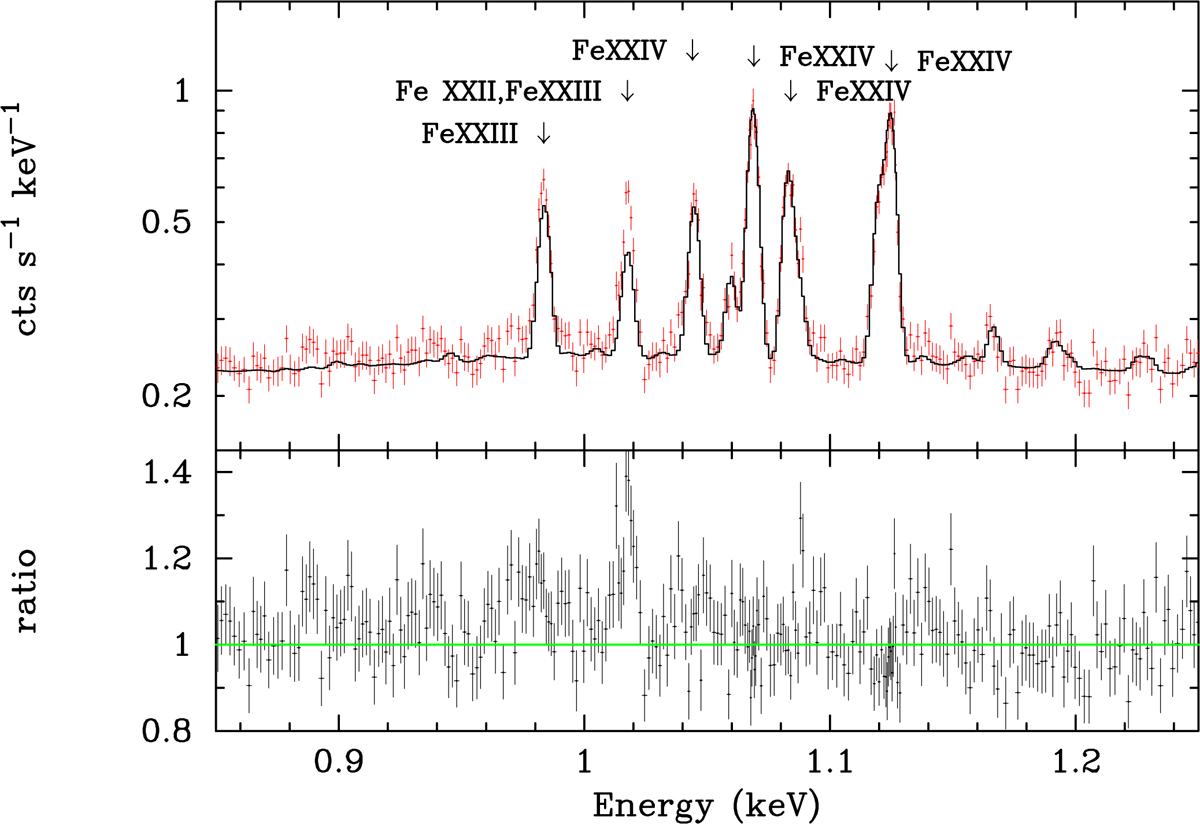
Fig. 10.
Download original image
Simulated XRISM spectrum based on best fitting model for A576, p = −100 (α = 0.99). The simulated exposure time is 500 ks. The spectrum is fitted with a one temperature apec model. In the top panel we show, in red, the simulated spectrum and in black the best fitting model. In the bottom panel we show residuals in the form of a ratio of data to model. Note how the model reproduces adequately lines from Fe XXIV but only partially lines from XXII and XXIII. More specifically, only half of the equivalent width of the line at 1.02 keV, corresponding to the 3p–> 2s transition, is reproduced by the model. The spectrum is shown in the observer frame.
Current usage metrics show cumulative count of Article Views (full-text article views including HTML views, PDF and ePub downloads, according to the available data) and Abstracts Views on Vision4Press platform.
Data correspond to usage on the plateform after 2015. The current usage metrics is available 48-96 hours after online publication and is updated daily on week days.
Initial download of the metrics may take a while.