Fig. 1.
Download original image
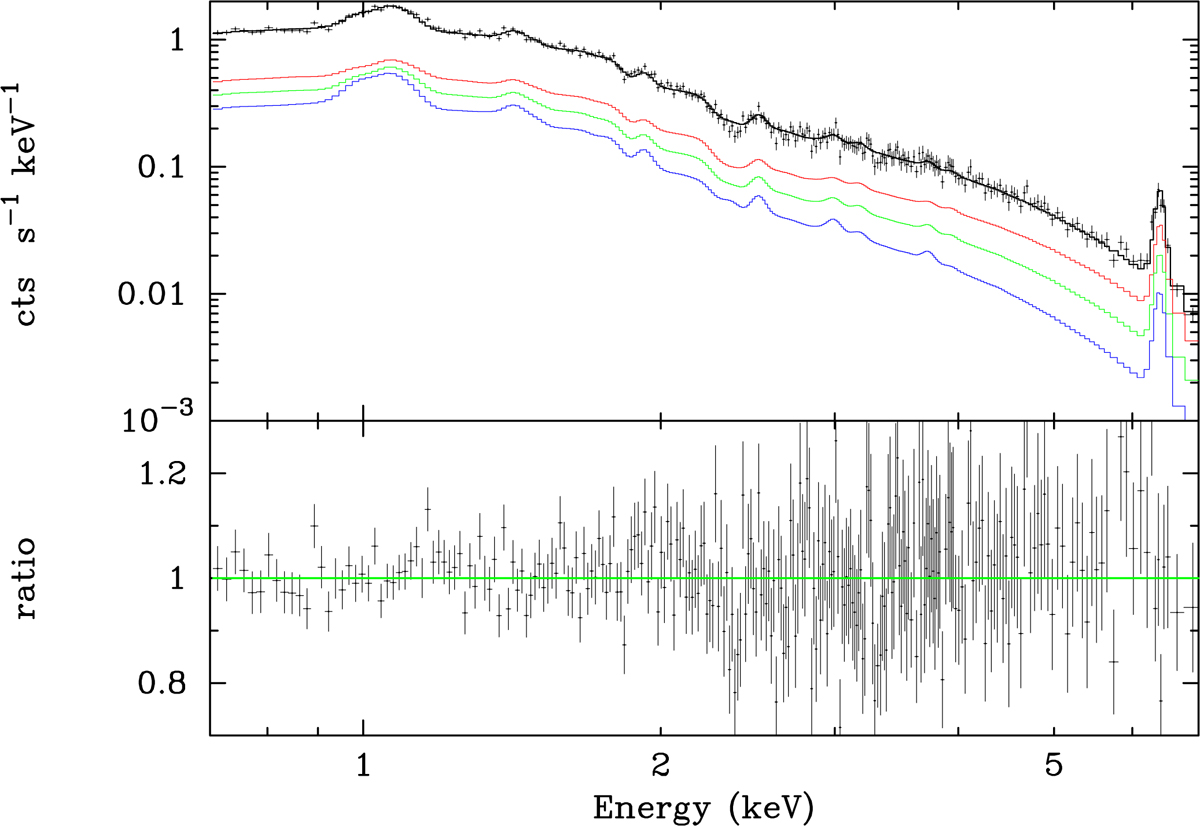
Spectrum extracted from the low entropy region of MKW3s fit with a sum of 3 single temperature apec models approximating the best-fitting wdem model (see text for details). In the top panel we show the observed spectrum, the best fitting model for the p = −100 (α = 0.99) case and its breakdown into 3 components, indicated respectively in red (4.1 keV), green (3.1 keV) and blue (2.4 keV). In the bottom panel we show residuals in the form of a ratio of data over model.
Current usage metrics show cumulative count of Article Views (full-text article views including HTML views, PDF and ePub downloads, according to the available data) and Abstracts Views on Vision4Press platform.
Data correspond to usage on the plateform after 2015. The current usage metrics is available 48-96 hours after online publication and is updated daily on week days.
Initial download of the metrics may take a while.