Open Access
Fig. 5.
Download original image
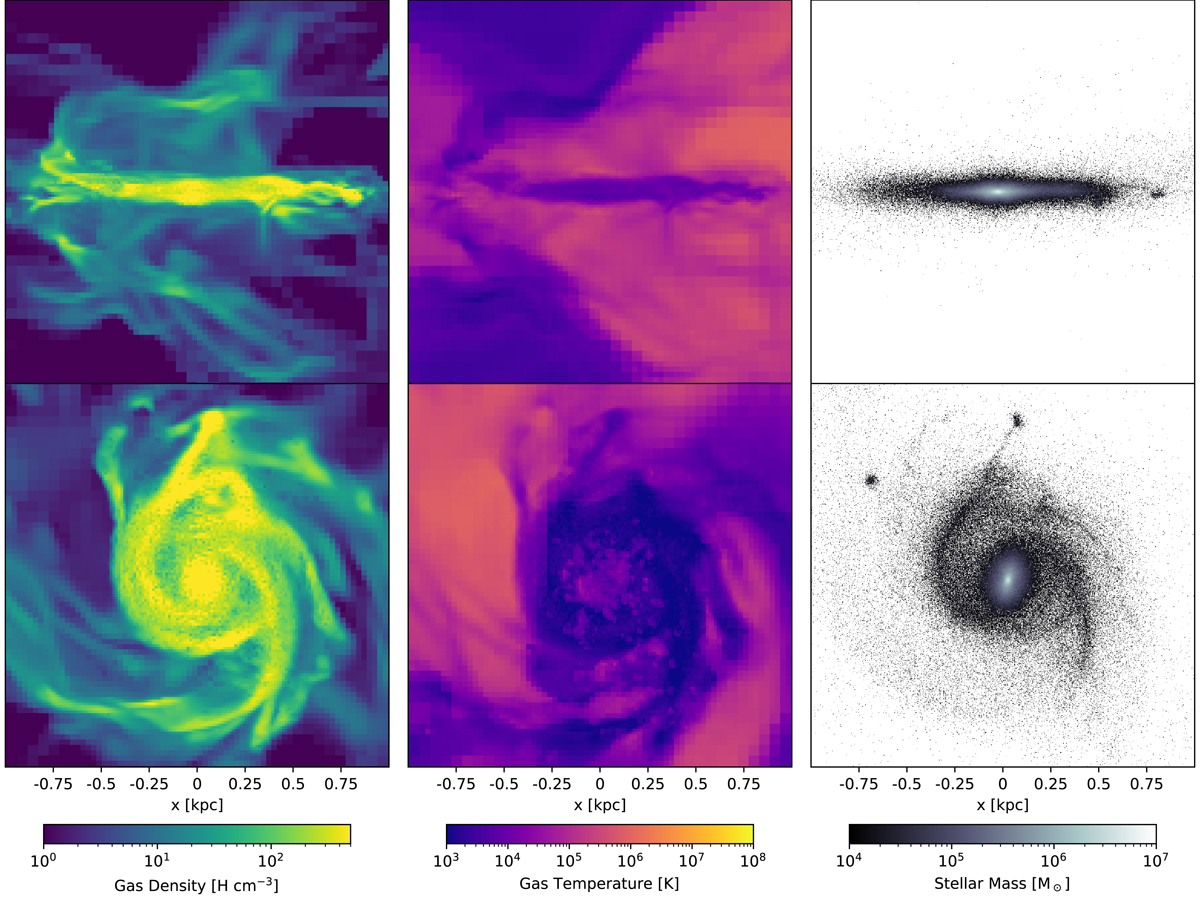
1 × 1 × 1 kpc edge-on (top) and face-on (bottom) projections of the galaxy at the centre of the DM halo at t = 160 Myr. The first column shows the gas density, the second column shows the gas temperature and the third column shows the stellar mass.
Current usage metrics show cumulative count of Article Views (full-text article views including HTML views, PDF and ePub downloads, according to the available data) and Abstracts Views on Vision4Press platform.
Data correspond to usage on the plateform after 2015. The current usage metrics is available 48-96 hours after online publication and is updated daily on week days.
Initial download of the metrics may take a while.