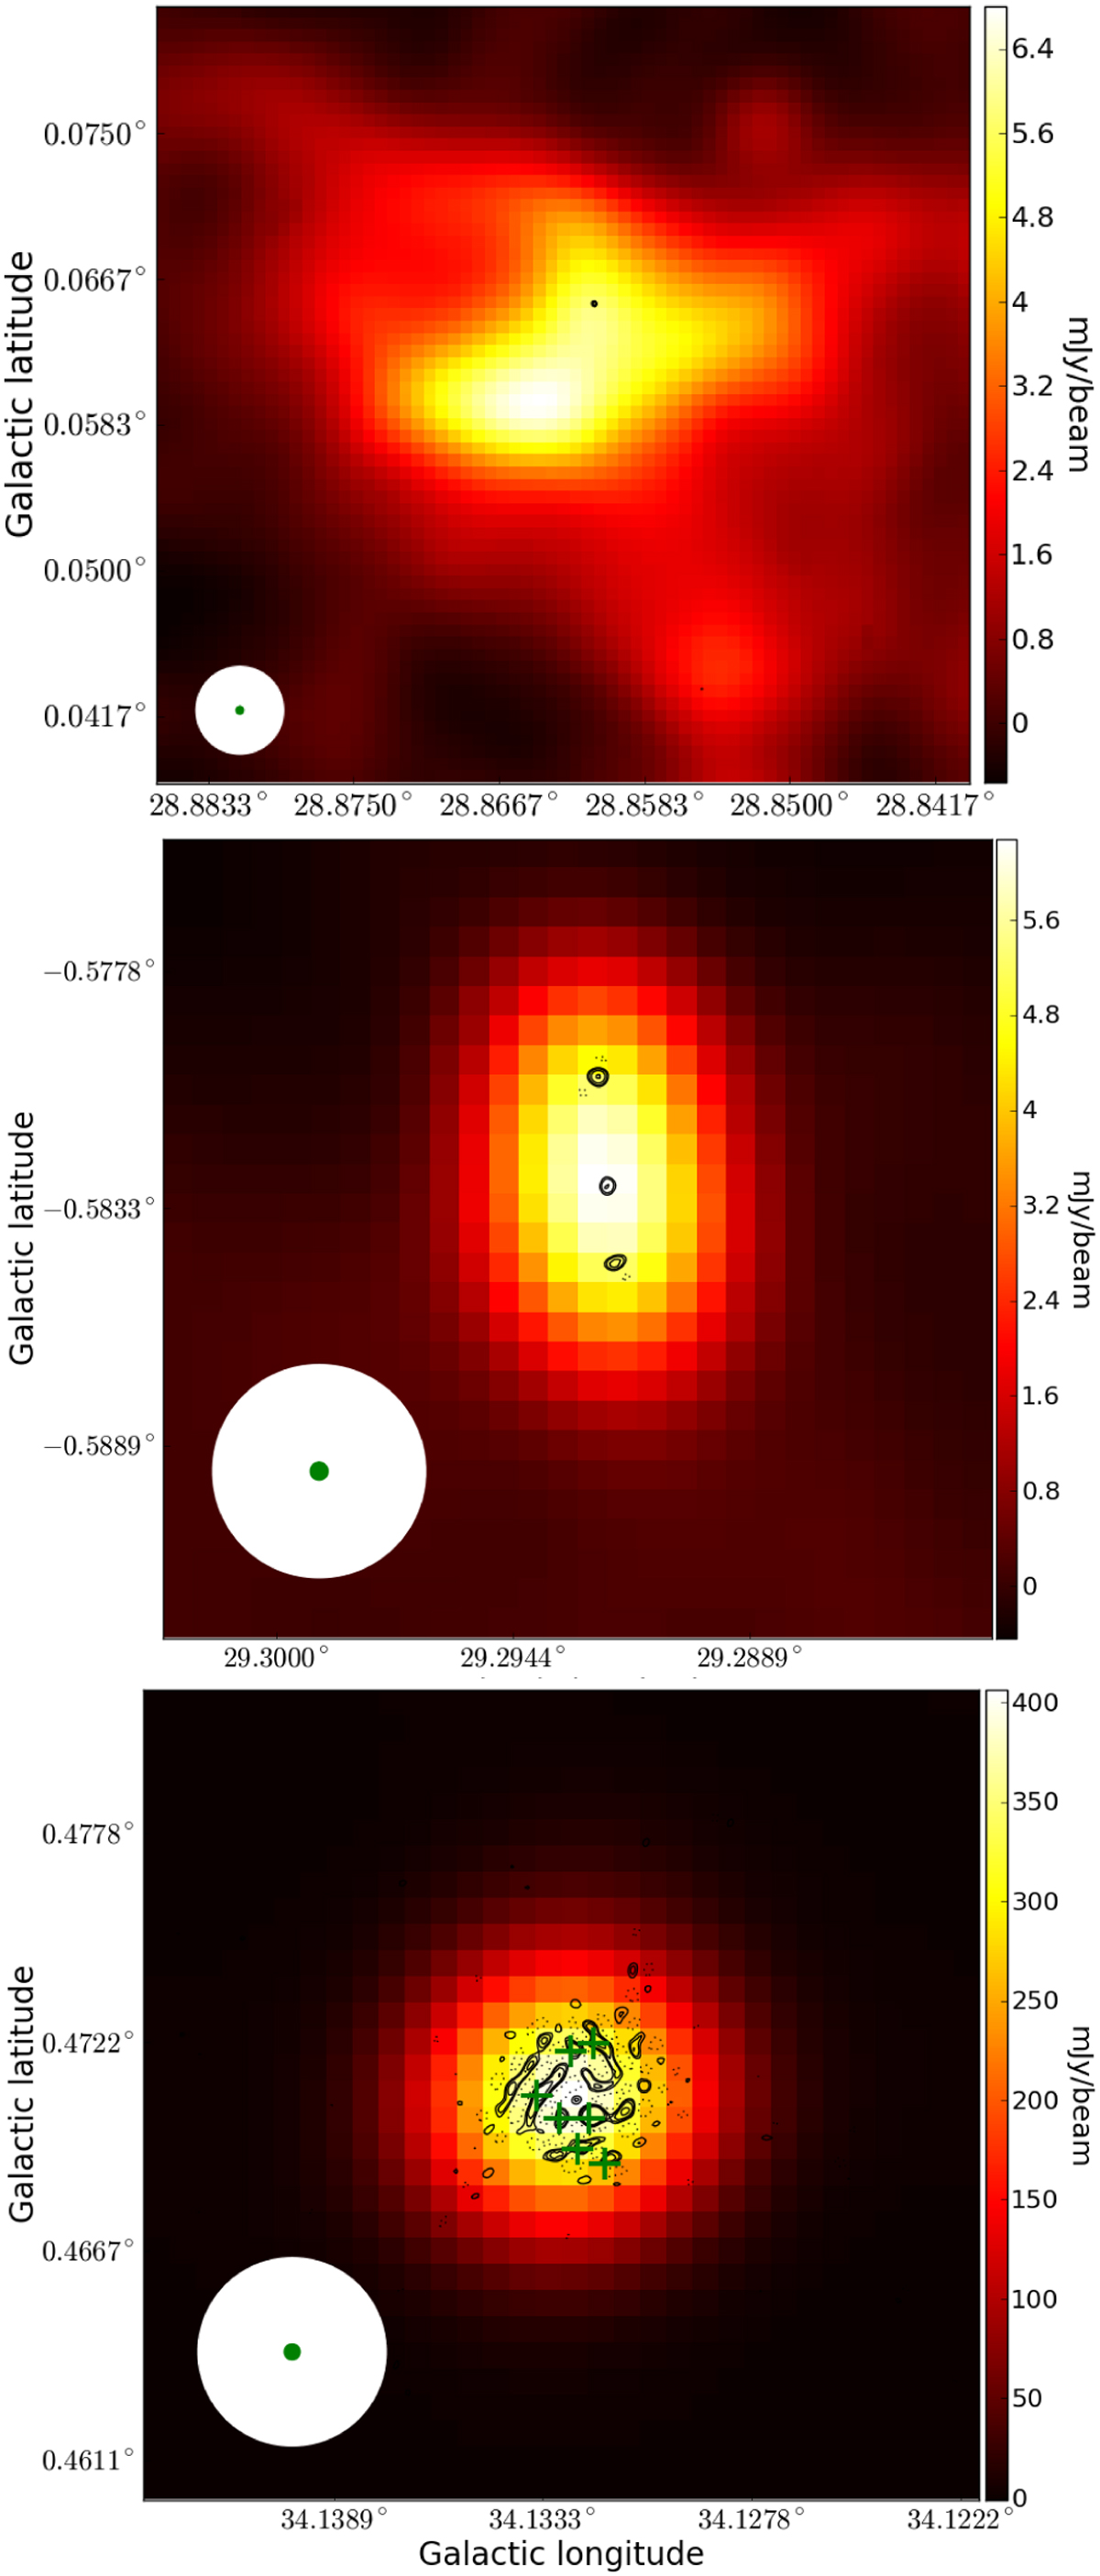
Fig. 3
Download original image
Source examples of the differences between the two sets of VLA images, D-configuration (background), and B-configuration (contours). The contour levels are −5.0, 5.0, 7.0, 10.0, and 15.0 times the 60 µJy beam−1, the mean noise level of the images. The circles at the bottom left side indicate the beam sizes of the D-configuration (18″, white) and B-configuration (1.″5, green) images. Top: B-configuration compact radio source seen in projection in the area of a D-configuration extended radio source. Middle: D-configuration compact source that is resolved in three individual compact radio sources in the B-configuration images. Bottom: D-configuration compact source that is resolved as a fragmented radio source. The position of fragments considered in the final catalog are indicated with green crosses.
Current usage metrics show cumulative count of Article Views (full-text article views including HTML views, PDF and ePub downloads, according to the available data) and Abstracts Views on Vision4Press platform.
Data correspond to usage on the plateform after 2015. The current usage metrics is available 48-96 hours after online publication and is updated daily on week days.
Initial download of the metrics may take a while.