Open Access
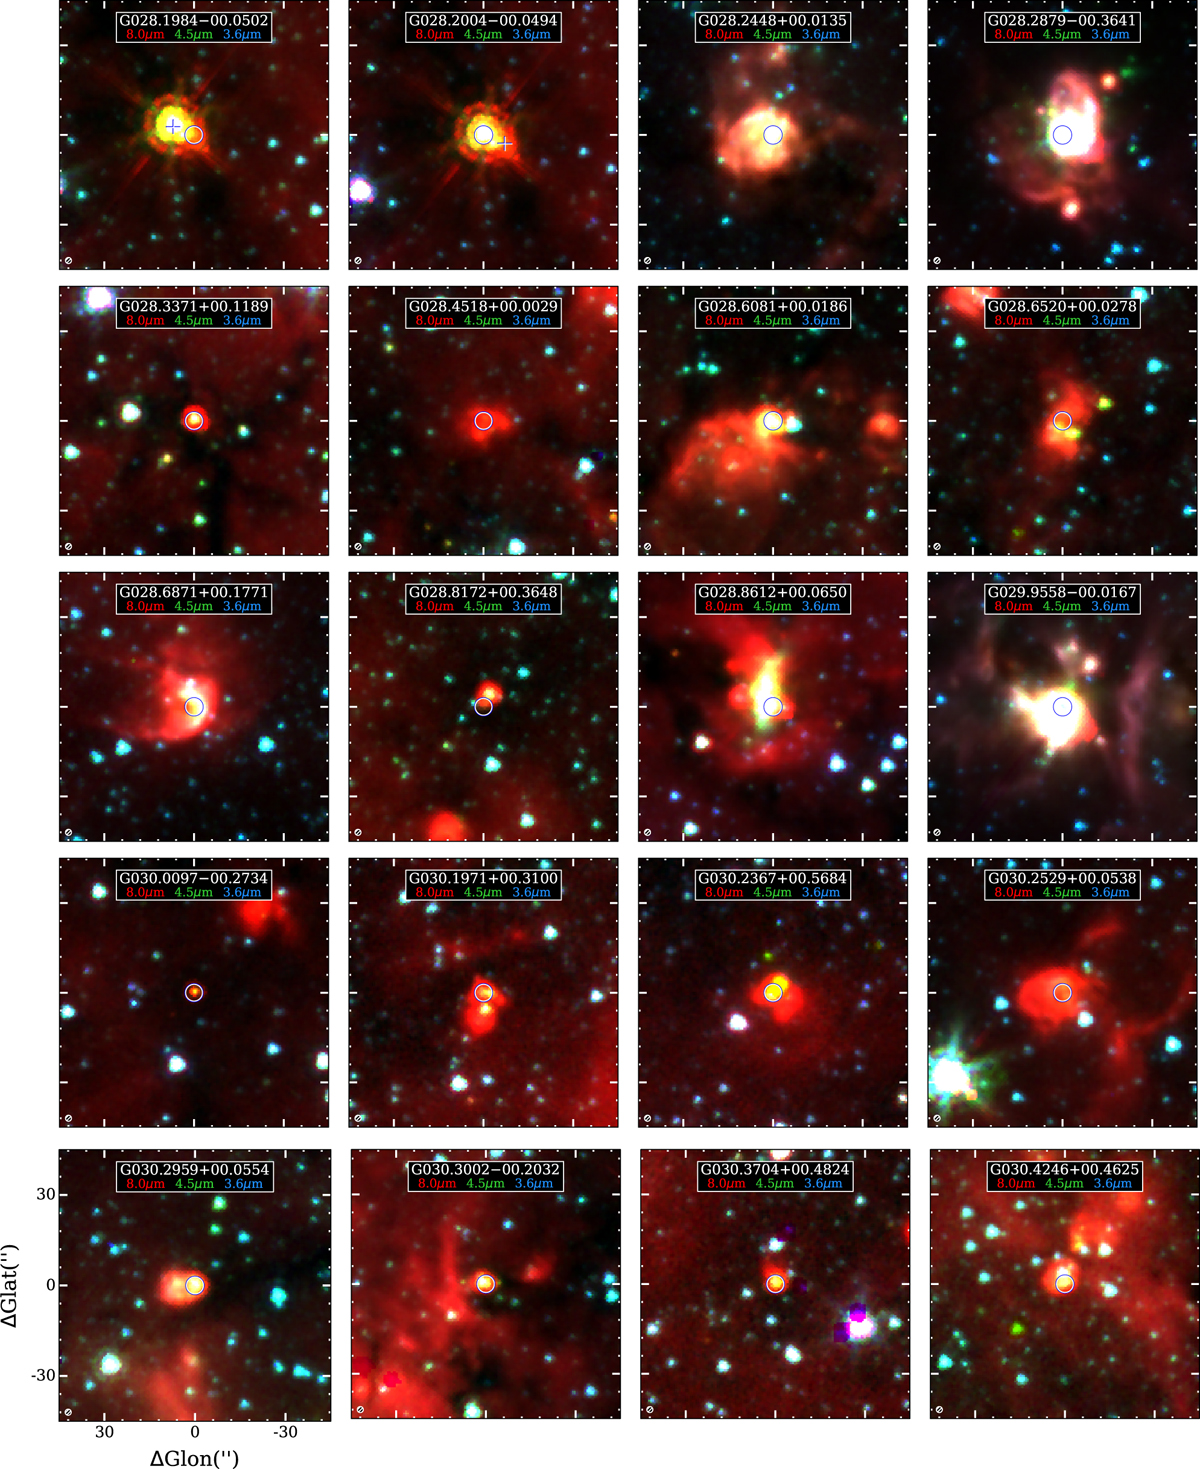
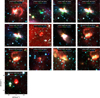
Fig. C.1
Download original image
Three-color GLIMPSE images at the position of the HII region candidates identified in the GLOSTAR B-configuration images. In the case of the fragmented HII regions, listed in Table 2, the position of additional fragment sources are shown with lime-white crosses.
This figure is made of several images, please see below:
Current usage metrics show cumulative count of Article Views (full-text article views including HTML views, PDF and ePub downloads, according to the available data) and Abstracts Views on Vision4Press platform.
Data correspond to usage on the plateform after 2015. The current usage metrics is available 48-96 hours after online publication and is updated daily on week days.
Initial download of the metrics may take a while.